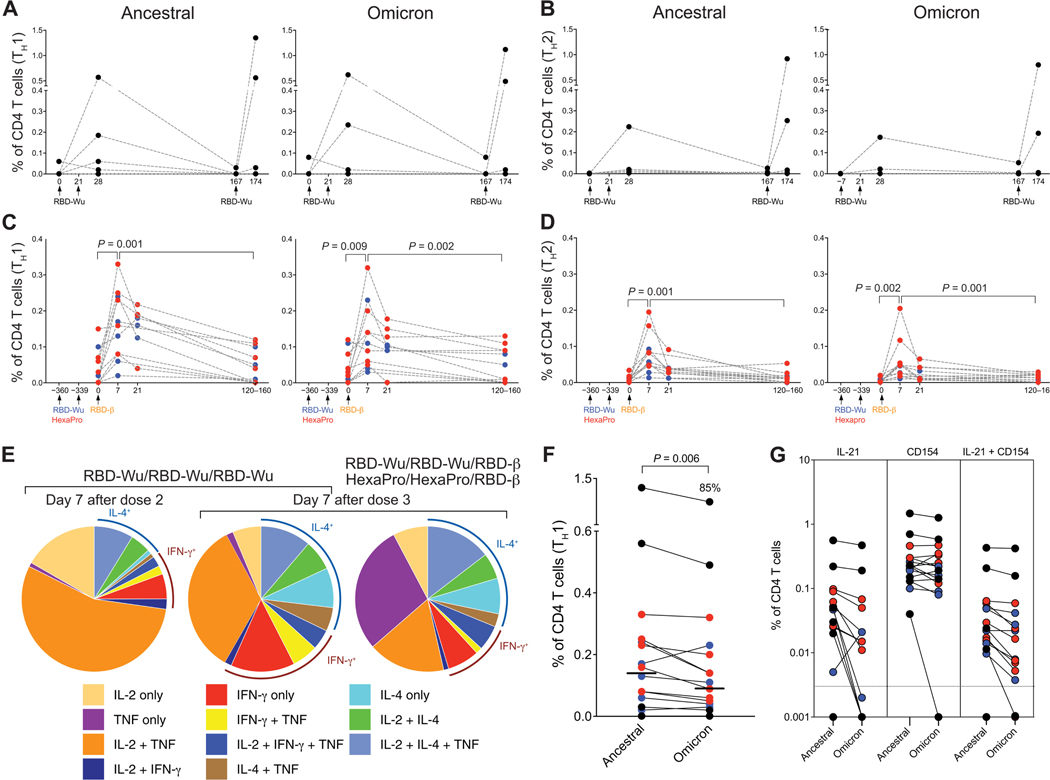
Fig. 4. AS03-adjuvanted RBD-I53–50 immunization elicits Spike protein–specific CD4 T cell responses.
(A and B) Frequency of Spike protein–specific CD4 T cells against ancestral (left) and Omicron (right) strains are shown for PBMC samples from the RBD-Wu/RBD-Wu/RBD-Wu group. (C and D) Frequency of Spike protein–specific CD4 T cells against ancestral (left) and Omicron (right) strains is shown for PBMC samples from the RBD-Wu/RBD-Wu/RBD-β (blue) and HexaPro/HexaPro/RBD-β (red) groups. CD4 T cells secreting IL-2, IFN-γ, or TNF are plotted as TH1-type responses (A and C), and IL-4–producing CD4 T cells are shown as TH2-type responses (B and D). The statistical differences between time points were determined using Wilcoxon matched-pairs signed rank test. (E) Pie charts representing the proportions of Spike protein–specific CD4 T cells expressing one, two, or three cytokines are shown. (F) Comparison of CD4 T cell frequencies between ancestral and Omicron viral strains measured on day 7 after final booster immunization is shown. The statistical difference was determined using Wilcoxon matched-pairs signed rank test. The percent value on top of Omicron represents the proportion of Omicron-specific responses relative to responses against the ancestral strain. The horizontal bars indicate median. (G) Spike protein–specific IL-21+, CD154+, and CD154+IL-21+ CD4 T cell responses were measured in samples collected on day 7 after final immunization. The horizontal dashed line indicates the lower limit of detection. In all plots, each circle represents an animal. In (F) and (G), black, blue, and red colors indicate RBD-Wu/RBD-Wu/RBD-Wu, RBD-Wu/RBD-Wu/RBD-β, and HexaPro/HexaPro/RBD-β groups, respectively.

