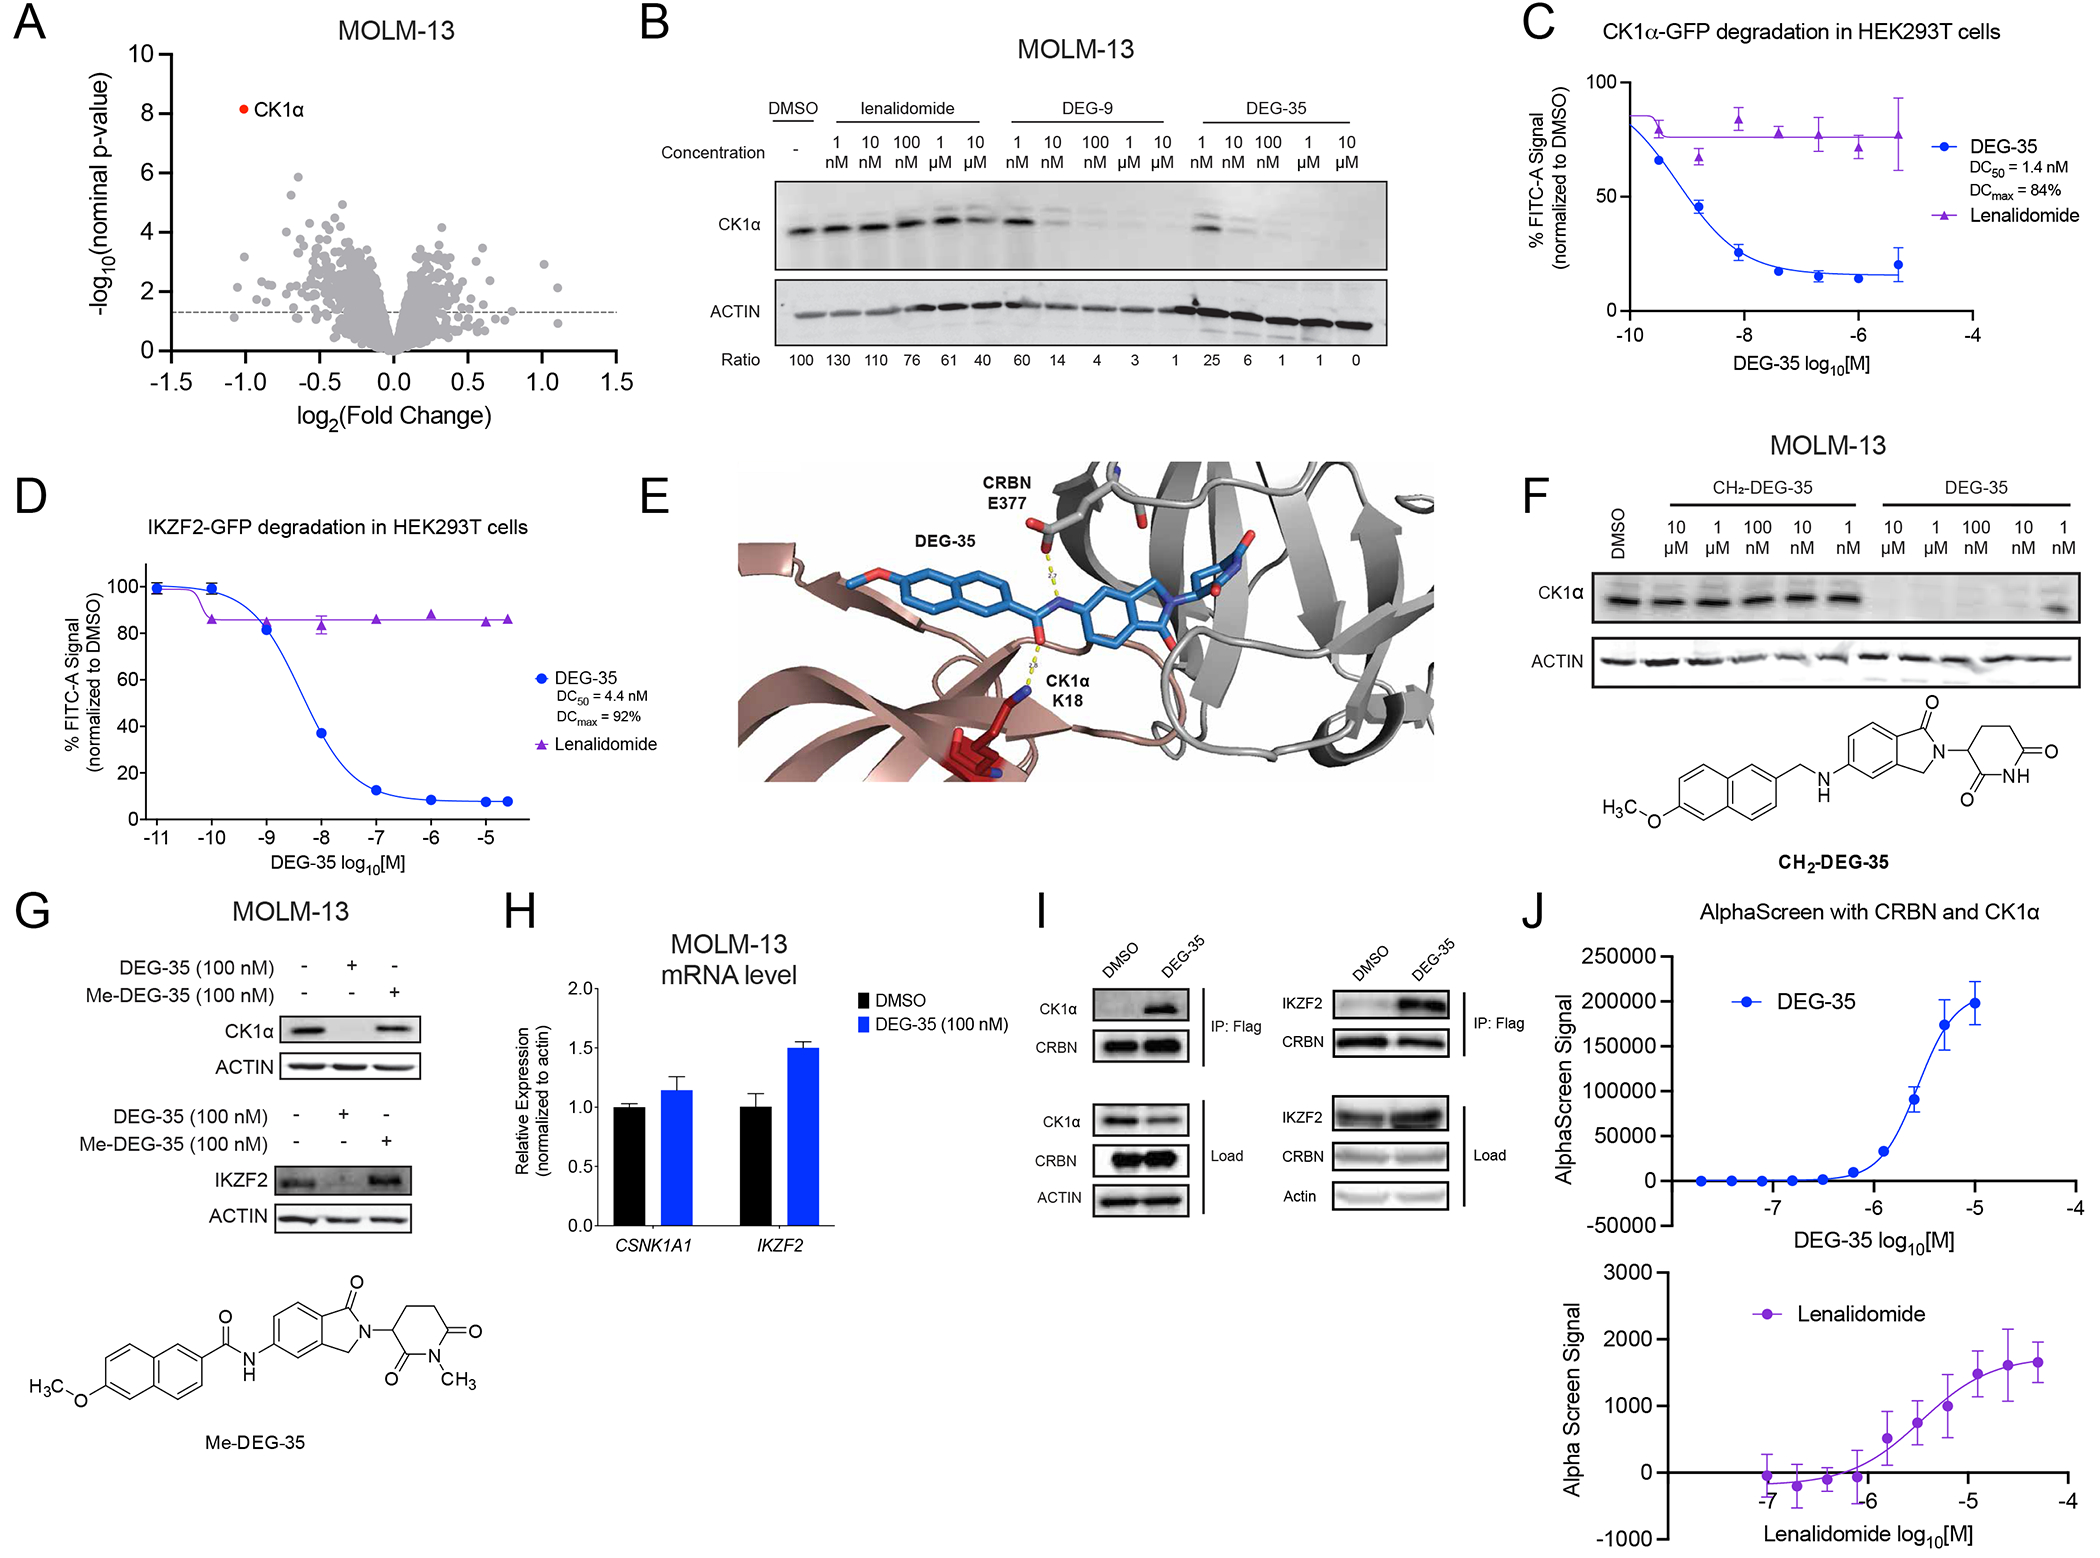
Figure 2. DEG-35 degrades dual targets IKZF2 and CK1α via Cullin-CRBN dependent pathway.

(A) Quantitative global proteomics analysis of MOLM-13 cells treated for 2 h with 50 nM DEG-35. (B) Western blot analysis of CK1α in MOLM-13 cells treated for 24 h with indicated drugs. (C,D) Flow cytometry analysis of HEK293T cells expressing (C) GFP-CK1α or (D) GFP-IKZF2 zinc finger 2 treated with DEG-35 for 5 h or 24 h respectively. Data shown is the mean ± SEM of three biological replicates and is representative of two independent experiments. (E) Docking model of DEG-35 with CK1α and CRBN. (F) Structure of CH2-DEG-35 and Western blot analysis of CK1α and IKZF2 in MOLM-13 cells treated with DEG-35 or CH2-DEG-35. (G) Structure of Me-DEG-35 and western blot analysis of CK1α and IKZF2 in MOLM-13 cells treated with DEG-35 or Me-DEG-35. (H) qRT-PCR analysis of CK1α and IKZF2 mRNA levels in MOLM-13 cells treated 24 h with 100 nM DEG-35. Data shown is the mean ± SEM of three biological replicates. (I) Western blot analysis of co-immunoprecipitation of endogenous CK1α and transiently expressed IKZF2 with Flag-CRBN in HEK293T. (J) In vitro analysis for lenalidomide or DEG-35 between His-CULT and streptactin-CK1α by AlphaScreen. Data shown is the mean ± SEM of three biological replicates and is representative of two independent experiments. See also Figure S2 and Table S2.
