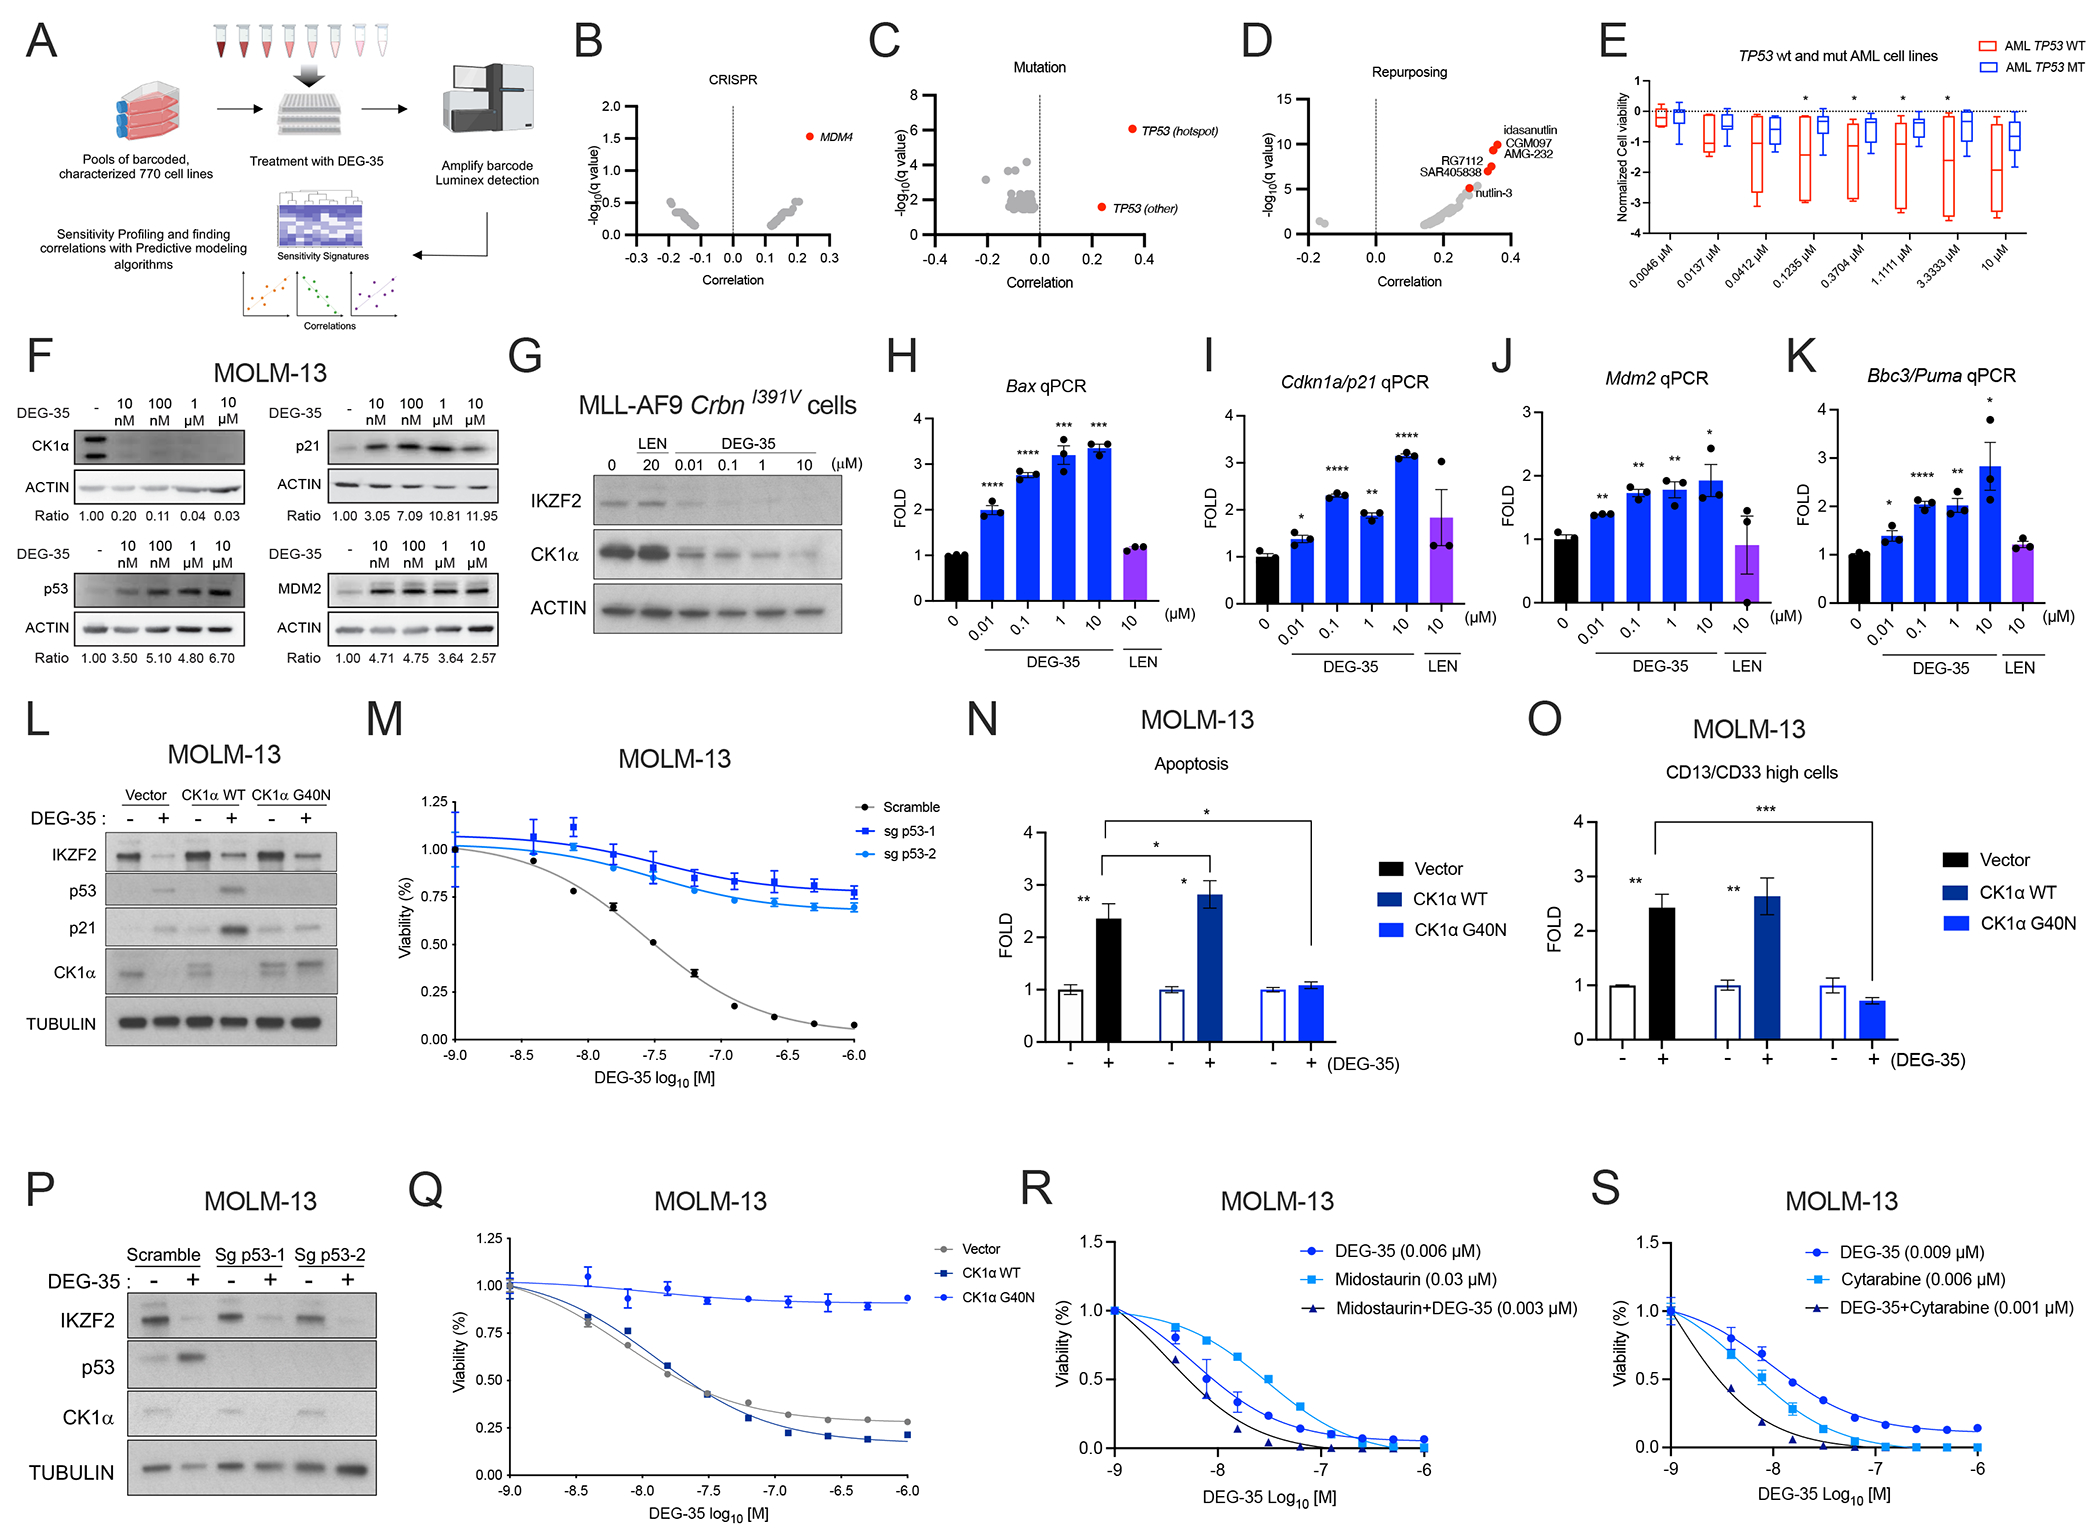
Figure 3. DEG-35 leads to activation of the p53 pathway via CK1α degradation.

(A) Scheme showing the layout of the PRISM platform. (B-D) Correlation results showing the sensitivity signature of 770 human cell lines to DEG-35 to (B) genes knocked out by CRISPR screens (C) mutations harbored in cell lines and (D) repurposed drugs from PRISM data. (E) Normalized cell viability of AML cell lines with wildtype and p53 mutation shown as box and whiskers plot presenting maximum and minimum values with median as the midline. Student’s t test was used, *p < 0.05. (F) Western blot analysis of p53 targets p21 and MDM2 in MOLM-13 cells treated with different doses of DEG-35 for 24 h. (G) Western blot analysis of CK1α and IKZF2 in MLL-AF9 CrbnI391V cells treated with different doses of DEG-35 for 24 h. (H-K) qPCR analysis of p53 targets (H) Bax, (I) Cdkn1a/p21, (J) Mdm2 and (K) Bbc3/Puma in MLL-AF9 CrbnI391V cells treated with different doses of DEG-35 for 24 h. (L) Western blot analysis of CK1α, IKZF2, p53, and p21 in MOLM-13 cells overexpressing CK1α WT, CK1α G40N, or vector control. (M) MOLM-13 cells overexpressing CK1α WT, CK1α G40N, or vector control were treated with DEG-35. 3 days post treatment cell viability was measured by Cell titer Glo assay. Data shown is a representative result of three independent experiments. Mean ± SEM of triplicates. (N,O) (N) Apoptosis and (O) differentiation were examined in MOLM-13 cells treated with DEG-35 for 2 days. (P) Western blot analysis showing protein levels of IKZF2, p53, and CK1α in MOLM-13 cas9 cells expressing sgRNA for TP53 and treated with DMSO or DEG-35. (Q) Cell viability was measured in MOLM-13 cells knocked out for p53 which were treated with DEG-35 for 3 days. Data shown is a representative result of three independent experiments. Mean ± SEM of triplicates. (R,S) Combination treatment of DEG-35 with (R) Midostaurin or (S) Cytarabine in MOLM-13 cells for 72 h, measured by Cell-titer glo assay. Representative data is shown from 3 independent experiments mean ± SEM of triplicates for (Q–S). Statistics for (H–K, N–O) are mean ± SEM of three independent experiments: Student’s t test, *p < 0.05, **p < 0.01, ***p < 0.001 and ****p < 0.0001. See also Figure S3 and Table S3 and S4.
