Figure 5.

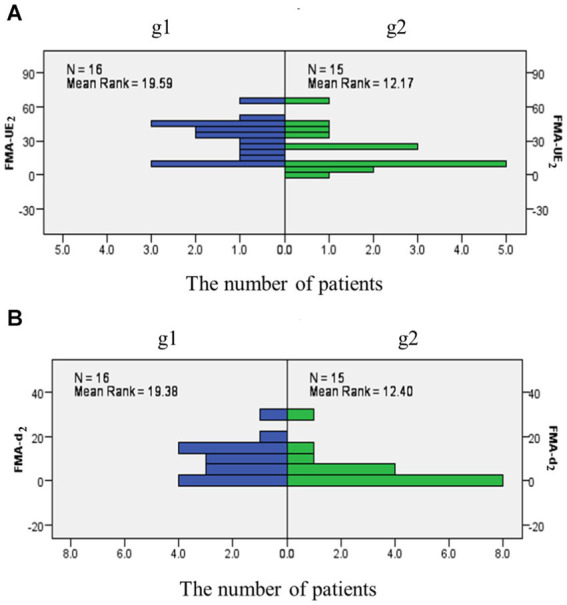
The frequency of FMA-UE2 and FMA-d2 in different groups. (A) The frequency distribution map as FMA-UE at 1 month later; (B) The frequency distribution map as FMA-d at 1 month later.

The frequency of FMA-UE2 and FMA-d2 in different groups. (A) The frequency distribution map as FMA-UE at 1 month later; (B) The frequency distribution map as FMA-d at 1 month later.