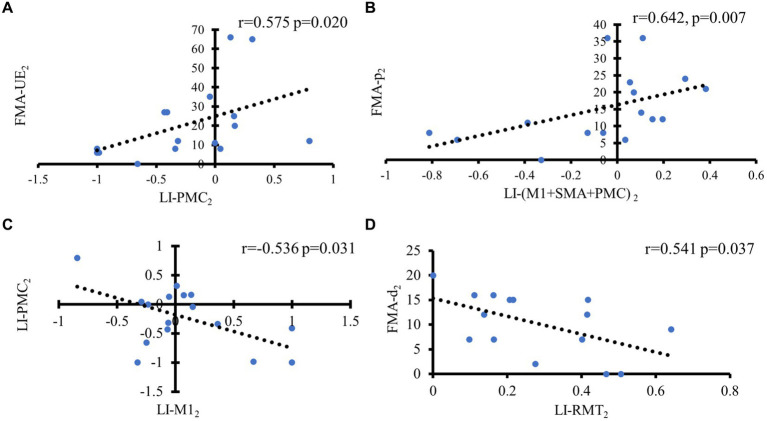
Figure 7.
Correlation analysis of motor outcome in different groups based on hemispheric asymmetry of corticospinal function. In the d(R) > 0 group, (A) Positive correlation between LI of PMC and FMA-UE at 1 month later; (B) Positive correlation between LI of M1 + SMA + PMC and FMA-p at 1 month later; (C) Negative correlation between LI-M1 and LI-PMC at 1 month later. In the d(R) < 0 group, (D) Negative correlation between FMA-d and LI-RMT at 1 month later.

