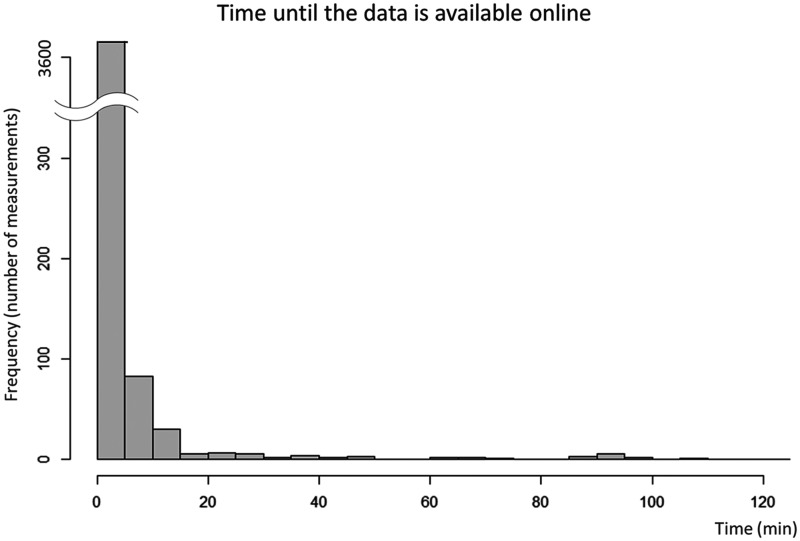
Figure 1.
Histogram for the time until the data is online.
The x and y axes show the time until the data become available online and the number of measurements, respectively. The median time until the measurements were available on the cloud system was only 0.35 min. The majority of the data (>95%) were available within 5 min of the measurement.

