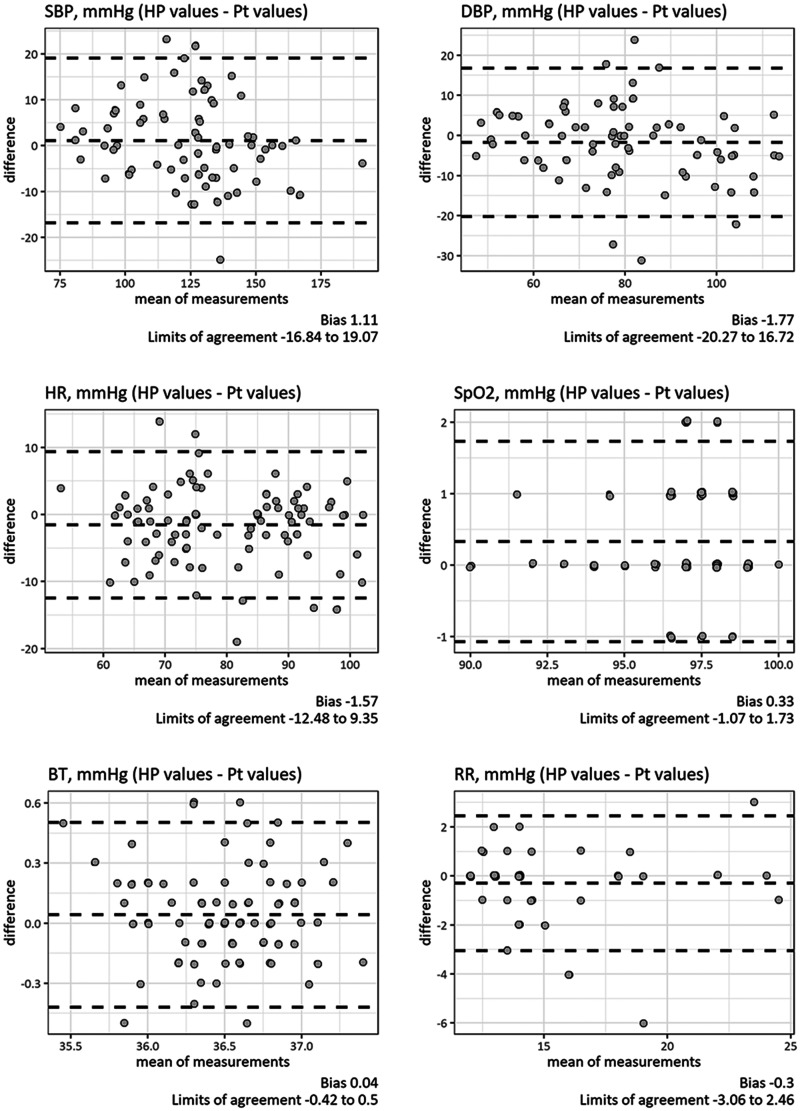
Figure 3.
Bland-Altman plots for vital sign measurements.
Bland-Altman plots showed no systematic error or bias in the measurements. All the parameters showed clinically acceptable agreement limits.
BT: body temperature; DBP: diastolic blood pressure; HP: healthcare provider; HR: heart rate; Pt: patient; RR: respiratory rate; SBP: systolic blood pressure; SpO2: peripheral oxygen saturation.

