Figure 3.
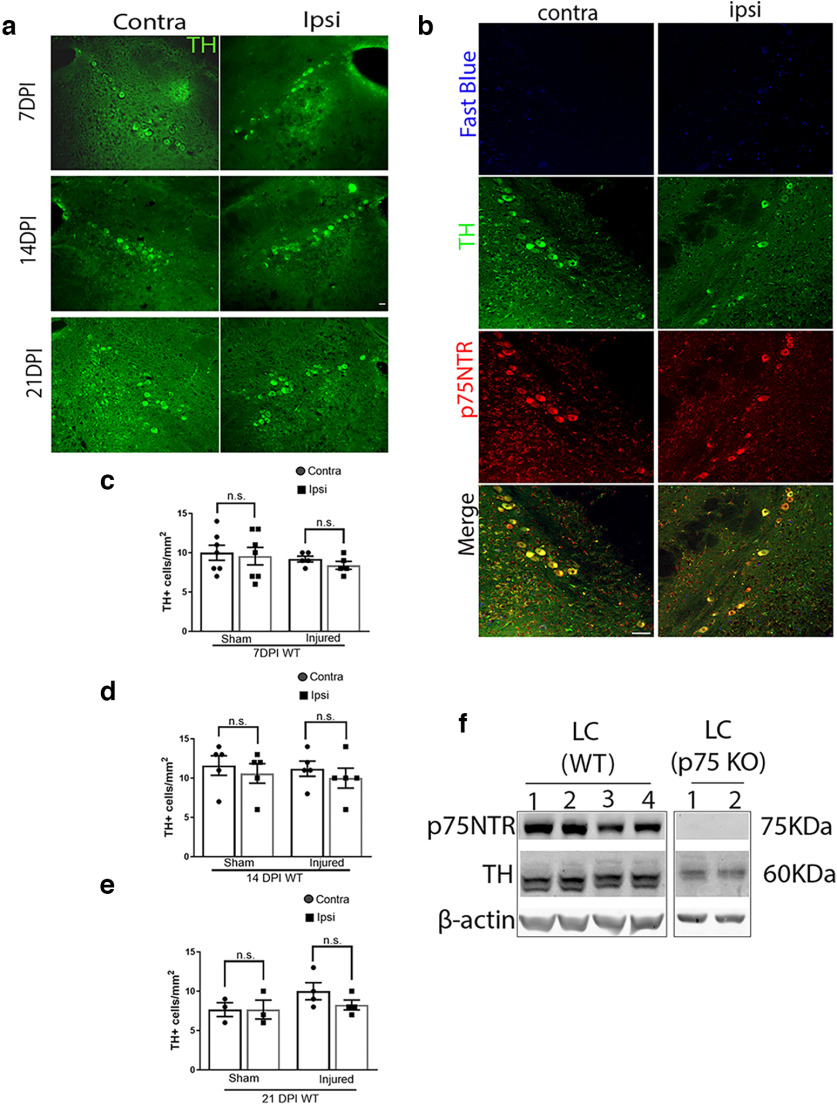
TH-positive cells in the locus ceruleus after cortical FPI; 7DPI, 14DPI, and 21 DPI sham and TB1 brains were obtained from wild-type adult mice after FPI. a, Coronal brain sections of the LC immunostained for TH (green) 7DPI, 14DPI, and 21DPI. b, Coronal brain sections of the naive LC showing absence of staining for Fast Blue (blue) 14 d after cortical Fast Blue injection in the uninjected versus injected side, coimmunolabeled with TH (green) and p75NTR (red); n = 4. c, Quantification of TH+ neurons in the ipsilateral versus contralateral side of the LC 7DPI in sham and injured mice. d, Quantification of TH+ neurons in the ipsilateral versus contralateral side of the LC 14DPI in sham and injured mice. e, Quantification of TH+ neurons in the ipsilateral versus contralateral side of the LC 21DPI in sham and injured mice. Statistical analysis was performed using one-way ANOVA, Tukey’s multiple-comparisons test. f, Western blot showing expression of p75NTR and TH in the LC in naive WT mice, along with a negative control using LC from p75NTR KO mice. Each Western blot lane represents an n; n = 5 WT LC, n = 4 p75NTR KO LC. Scale bars: 50 μm.

