FIGURE 5.

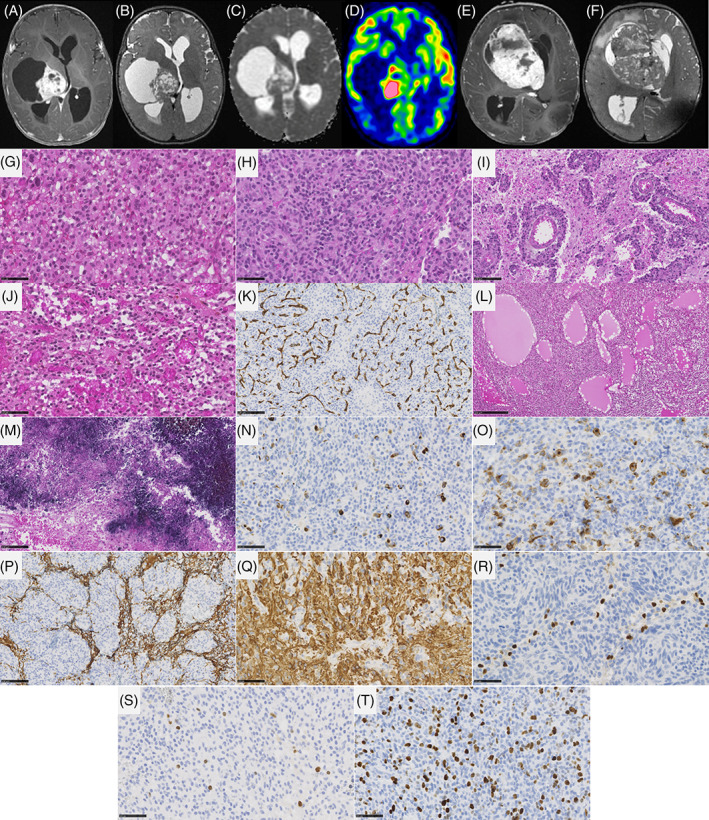
Imaging and histopathological features of embryonal tumors, with PLAGL2 amplification. (A–D) MR images of case #30, showing a right thalamic mass. The mass has cystic and tissular content on T2‐weighted images (B). The tissular part display avid contrast enhancement (A), intermediate diffusion restriction (C), very high cerebral blood flow using ASL (157 mL/min/100 g) (D). (E, F) MR images of case #29, showing a right caudate nucleus mass. The mass has tissular (mostly) and cystic content on T2‐weighted images (F). The tissular part display avid contrast enhancement (E). (G, H) Densely cellular neoplasm composed of monotonous round or spindle tumor cells (case #30, HPS, magnification 400×). (I) Perivascular disposition of tumor cells (case #30, HPS, magnification 200×). (J, K) Tumor with a dense capillary network without microvascular proliferation (case #30, HPS, magnification 400×, and CD34, magnification 200×). (L) Microcystic modifications (case #30, HPS, magnification 100×). (M) Necrosis with calcifications (case #30, HPS, magnification 200×). (N, O) A subset of tumor cells express neuronal markers (case #30, neurofilament, magnification 400×, and synaptophysin, magnification 400×). (P) Residual expression of GFAP without staining of tumor cells (case #30, magnification 200×). (Q) Strong expression of GFAP by tumor cells in another case (case #29, magnification 400×). (R) No immunoexpression of Olig2 by tumor cells (case #30, magnification 400×). (S, T) Variable MIB labeling index (case #29 and 30, magnification 400×). Black scale bars represent 250 μm (L), 100 μm (I, K, M, P), and 50 μm (G, H, J, N, O, Q–T). ASL, arterial spin labeling; HPS, hematoxylin–phloxin–saffron; MR, magnetic resonance.
