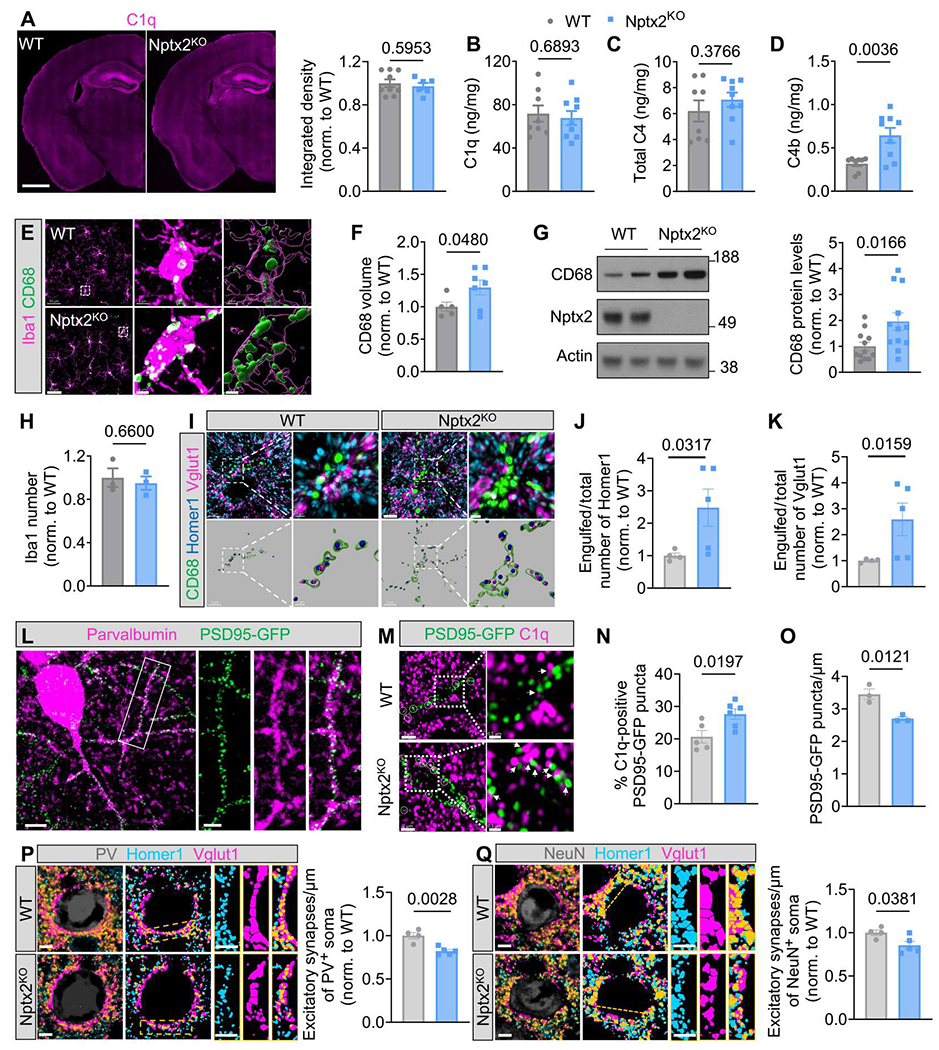
Fig. 2. Nptx2 regulates complement activity in vivo.

(A) Shown on the left are representative images of C1q immunostaining in WT and Nptx2KO mice brains. Scale bar, 1000 μm. The right shows quantification of C1q immunofluorescence in WT and Nptx2KO brains. P values were determined by unpaired t test. n = 9 for WT; n = 6 for Nptx2KO. Norm., normalized. (B to D) C1q (B), C4 (C), and C4b (D) concentration in WT and Nptx2KO cortices was measured by ELISA. P values were determined by unpaired t test. n = 8 for WT; n = 9 for Nptx2KO. (E) Shown are representative confocal images of CD68 (green) and Iba1 (magenta) immunostaining in WT and Nptx2KO cortical layers II to V. Scale bars, 30 μm and 2 μm (inset). (F) CD68 volume was quantified in WT and Nptx2KO cortical layers II to V. P values were determined by unpaired t test. n = 5 for WT; n = 7 for Nptx2KO. (G) Representative Western blots and quantification show CD68 abundance in hippocampi from WT and Nptx2KO cortices. P values were determined by unpaired t test. n = 12 for WT; n = 12 for Nptx2KO. (H) The number of Iba1+ microglia in WT and Nptx2KO whole brains was quantified. P values were determined by unpaired t test. n = 3 for WT; n = 3 for Nptx2KO. (I to K) Shown are representative confocal images and three-dimensional (3D) surface rendering of immunostained CD68 (green), Vglut1 (magenta), and Homer1 (blue) in WT and Nptx2KO cortical layers II to V (I). Scale bars, 5 μm and 1 μm (inset). Homer1 (J) and Vglut1 (K) puncta inside CD68+ lysosomes were quantified. P values were determined by unpaired t test. n = 4 for WT; n = 5 for Nptx2KO. (L) Representative confocal images of PSD95-GFP and immunostained parvalbumin are shown in samples from PSD95-GFPf/f:PV-Cre WT cortical layers II to V. Scale bars, 10 μm and 4 μm (inset). (M) Shown are representative confocal images of immunostained C1q (magenta) and PSD95-GFP (green) in PSD95-GFPf/f:PV-Cre:WT and Nptx2KO hippocampus CA1 strata radiata. White circles and white arrowheads indicate C1q colocalized with PSD95-GFP. Scale bars, 2 μm and 0.5 μm (inset). (N) The percentage of C1q + PSD95-GFP puncta in WT and Nptx2KO hippocampi was quantified. P values were determined by unpaired t test. n = 5 for WT; n = 6 for Nptx2KO. (O) PSD95-GFP puncta density was quantified in PSD95-GFPf/f:PV-Cre:WT and Nptx2KO hippocampi. P values were determined by unpaired t test. n = 3 for WT; n = 3 for Nptx2KO. (P) Shown on the left are representative confocal images and mask of immunostained PV (gray), Homer1 (blue), and Vglut1 (magenta) in WT and Nptx2KO cortical layers II to V. The bar graph on the right shows excitatory synapse density around somas of PV+ cells. P values were determined by unpaired t test. n = 4 for WT; n = 5 for Nptx2KO. Scale bars, 5 μm. (Q) Shown on the left are representative confocal images and mask of immunostained NeuN (gray), Homer1 (blue), and Vglut1 (magenta) in WT and Nptx2KO cortical layers II to V. Scale bars, 5 μm. The bar graph on the right shows normalized number of excitatory synapses around NeuN+ soma. P values were determined by unpaired t test. n = 4 for WT; n = 5 for Nptx2KO. Scale bars, 5 μm. Data are presented as means ± SEM. Each dot represents data from one mouse.
