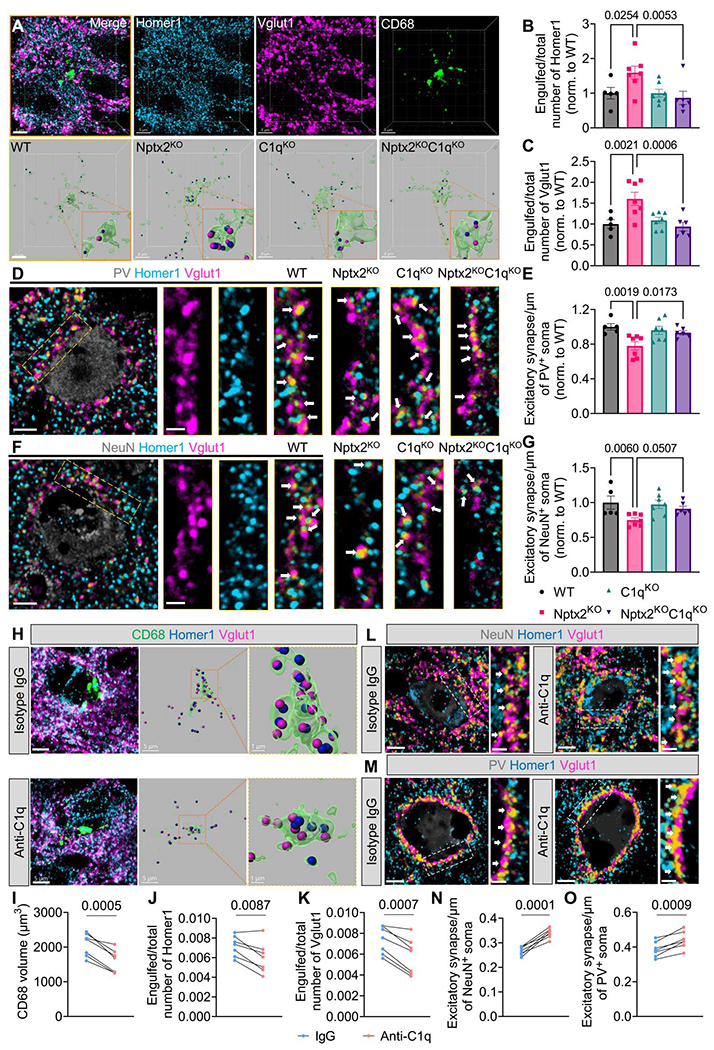
Fig. 3. Complement inhibition rescues synapse loss in Nptx2KO brains.

(A) Shown are representative confocal images and 3D surface reconstructions of Homer1 (blue), Vglut1 (magenta), and CD68 (green) in mouse cortical layers II to IV. Scale bars, 5 μm. (B and C) The relative amount of Homer1 (B) and Vglut1 (C) puncta within CD68+ microglial lysosomes was quantified. P values were determined by one-way ANOVA followed by Šidák post hoc test. n = 5 for WT; n = 7 for Nptx2KO; n = 7 for C1qKO; n = 6 for Nptx2KO;C1qKO. (D and E) Shown are representative confocal images (D) and quantification (E) of excitatory synapse density around somas of PV+ cells in the cortical layers II to V. White arrows indicate synapses, which were identified by colocalization of Homer1 and Vglut1 puncta. P values were determined by one-way ANOVA followed by Šidák post hoc test. n = 5 for WT; n = 7 for Nptx2KO; n = 7 for C1qKO; n = 6 for Nptx2KO;C1qKO. Scale bars, 5 μm and 2 μm (inset). (F and G) Shown are representative confocal images (F) and quantification (G) of excitatory synapse density around somas of NeuN+ cells in cortical layers II to V. White arrows indicate synapses, which were identified by colocalization of Homer1 and Vglut1 puncta. P values were determined by one-way ANOVA followed by Šidák post hoc test. n = 5 for WT; n = 7 for Nptx2KO; n = 7 for C1qKO; n = 6 for Nptx2KO;C1qKO. Scale bars, 5 μm and 2 μm (inset). (H) Shown are representative confocal images and 3D surface reconstructions of CD68 (green), Vglut1 (magenta), and Homer1 (blue) in control IgG and C1q-blocking antibody-injected Nptx2KO cortices. Scale bars, 5 μm and 1 μm (inset). (I) Volume of CD68+ microglial lysosomes in the cortices of Nptx2KO mice injected with control IgG and C1q-blocking antibody was quantified. P value was determined by paired t test. n = 7. (J and K) The relative amount of Homer1 (J) and Vglut1 (K) puncta within CD68+ microglial lysosomes was quantified in the cortices of Nptx2KO mice injected with isotype IgG antibody or C1q-blocking antibody. P values were determined by paired t test. n = 7. (L) Shown are representative confocal images of immunostained NeuN (gray), Homer1 (blue), and Vglut1 (magenta) in the cortical layers II-V of Nptx2KO mice injected with control IgG or C1q-blocking antibody. White arrows indicate synapses, which were identified by colocalization of Homer1 and Vglut1. P value was determined by paired t test. n = 7; Scale bars, 5 μm and 2 μm (inset). (M) Shown are representative confocal images of immunostained PV (gray), Homer1 (blue), and Vglut1 (magenta) in the cortical layers II to V of Nptx2KO mice injected with control IgG or C1q-blocking antibody. White arrows indicate synapses, which were identified by colocalized Homer1 and Vglut1 puncta. Scale bars, 5 μm and 2 μm (inset). (N) Excitatory synapse density around somas of NeuN+ cells was quantified. P value was determined by paired t test. n = 7. (O) Excitatory synapse density around somas of PV+ cells was quantified. P value was determined by paired t test. n = 7. Data are presented as means ± SEM. Each dot represents data from one mouse.
