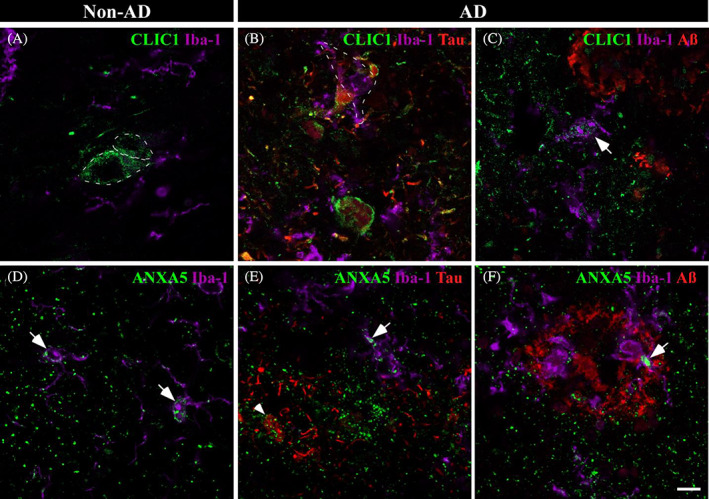
FIGURE 6.

Microglial involvement in amygdaloid pathology in AD. Immunofluorescences against CLIC1 (A–C) and ANXA5 (D–F) and pathological markers are shown. In non‐AD samples, CLIC1 (A, green) labeling suggested possible expression in neurons (dashed line). In AD, CLIC1 colocalized intimately with Tau pathology (B, red) and microglia (purple, dashed line). Additionally, CLIC1 expression was observed in the microglial cells nearest to Aβ plaques (red) (C, arrow). ANXA5 (D, green) was related to microglia (purple, arrow) in non‐AD tissue. Microglial ANXA5 expression was increased in AD (E,F, arrow) with a closed spatial expression with Aβ plaques (E, reed) and Tau deposits (F, arrowhead). Scale bar = 10 μm.
