
FIGURE 5.
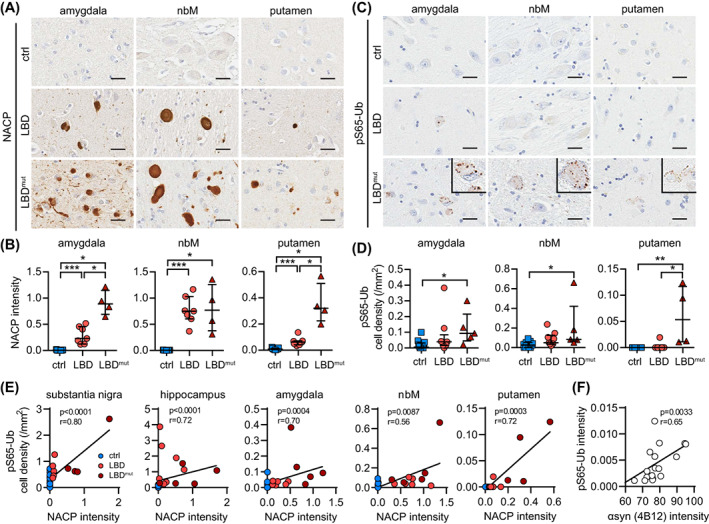
The mitophagy marker pS65‐Ub is increased across regions in human autopsy LBD brains with SNCA missense mutations or multiplications. Representative images of (A) αsyn (stained by NACP) and (C) pS65‐Ub immunostaining in the indicated brain regions from control, LBD, and LBDmut groups. Insets show magnified views of pS65‐Ub positive cells in all three regions. Scale bar: 25 μm. (B) NACP intensity is significantly increased in LBD and increased further in the LBDmut group in the amygdala, nbM, and putamen compared to the age‐matched controls (p < 0.0001 for LBD, p = 0.0015 for LBDmut, p = 0.0061 for LBD vs. LBDmut). (D) pS65‐Ub‐positive cell density is significantly increased only in the LBDmut group in the amygdala (p = 0.004), nbM (p = 0.0053), and putamen (p = 0.0005) compared to age‐matched controls. Kruskal–Wallis and Mann–Whitney U tests followed by adjustment with Bonferroni correction, *p < 0.0167 (i.e., the statistical significance threshold after Bonferroni correction), **p < 0.001, ***p < 0.0001. Data is shown as median with interquartile range. (E) pS65‐Ub positive cell density and NACP intensity are strongly correlated in the substantia nigra, hippocampus, amygdala, nbM, and putamen. Spearman's test of correlation, significance threshold: p < 0.01. n = 11–15 for controls, n = 6–9 for LBD group, n = 4–5 for LBDmut group. nbM, nucleus basalis of Meynert. (F) pS65‐Ub and human αsyn levels are strongly correlated in brains of Line D mice. Spearman's test of correlation, significance threshold: p < 0.05. n = 18.