
FIGURE 6.
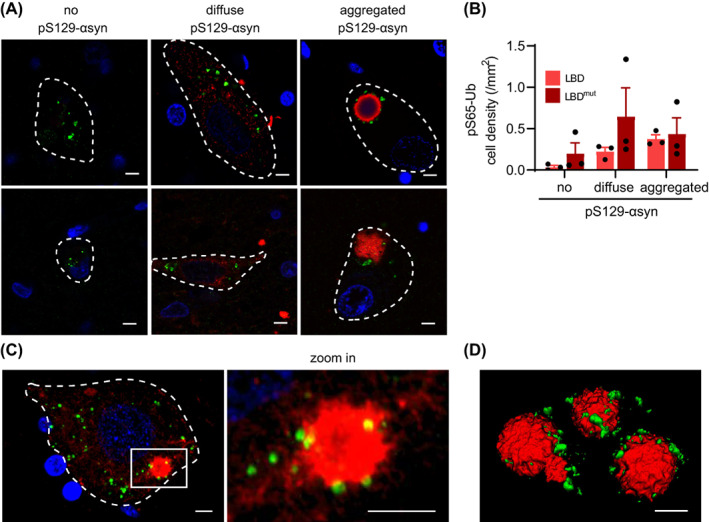
Spatial relationship between pS65‐Ub and αsyn pathology in LBD. (A) Representative images of pS65‐Ub positive cells with different pS129‐αsyn immunoreactive signals. Classical (top right image) and cortical (bottom right image) LBs with double immunostaining of pS65‐Ub (green) and pS129‐αsyn (red) are shown. (B) The quantification of pS65‐Ub‐positive cell density that was categorized based on their respective pS129‐αsyn immunoreactivity in the substantia nigra of three LBD and three LBDmut cases. (C) Representative immunofluorescence images in 3D maximum projection rendering of one cell containing small pS129‐αsyn‐positive aggregation is shown. A magnified image of the boxed area is shown to the right. pS65‐Ub‐positive granules (green) surround the pS129‐αsyn‐positive aggregation (red). (D) The spatial relationship of pS65‐Ub‐ and pS129‐αsyn‐positive LB is shown in 3D surface rendering.