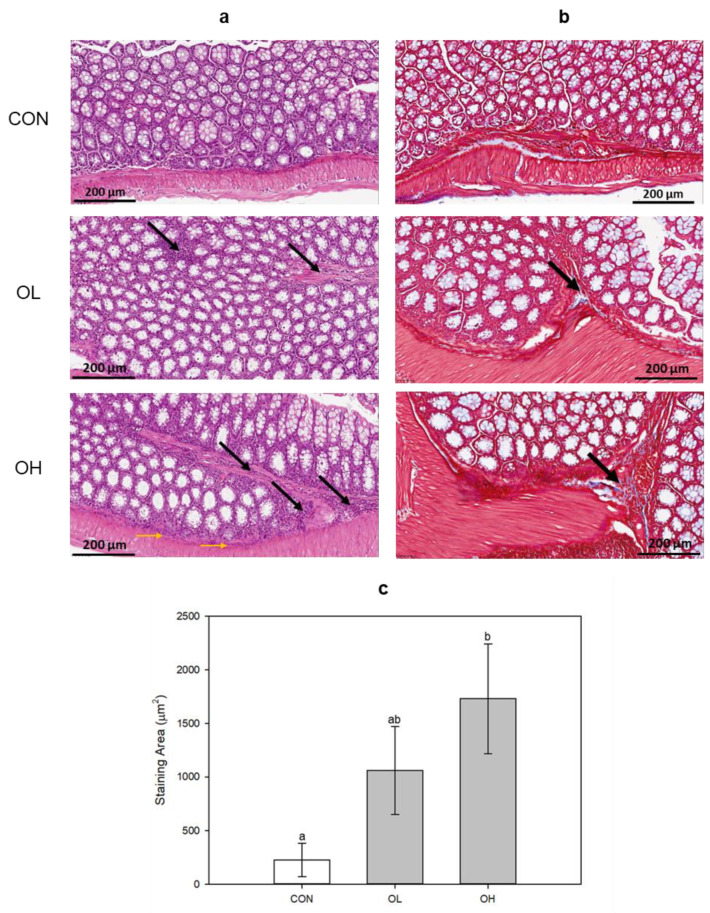
Figure 1.
Histopathological changes in colon tissues by (a) H&E and (b) MT staining. (c) Areas stained with MT were expressed (μm2). In H&E (original magnification × 40; scale bar, 200 μm), the black arrows indicate submucosa inflammatory infiltration (neutrophil and lymphocyte), and the yellow arrows indicate muscle layer inflammatory infiltration. In MT staining (original magnification × 40; scale bar, 200 μm), the black arrows indicate the location of fibrosis. CON: untreated control; OL: ochratoxin A (OTA)-low (1 mg OTA/kg body weight (B.W.)); OH: OTA-high (3 mg OTA/kg B.W.). Data represent the mean ± S.D. of experiments with 3 mouse colon tissues per group, and significance was determined compared with the control by Duncan’s studentized range test; different letters mean significant differences at p < 0.05.

