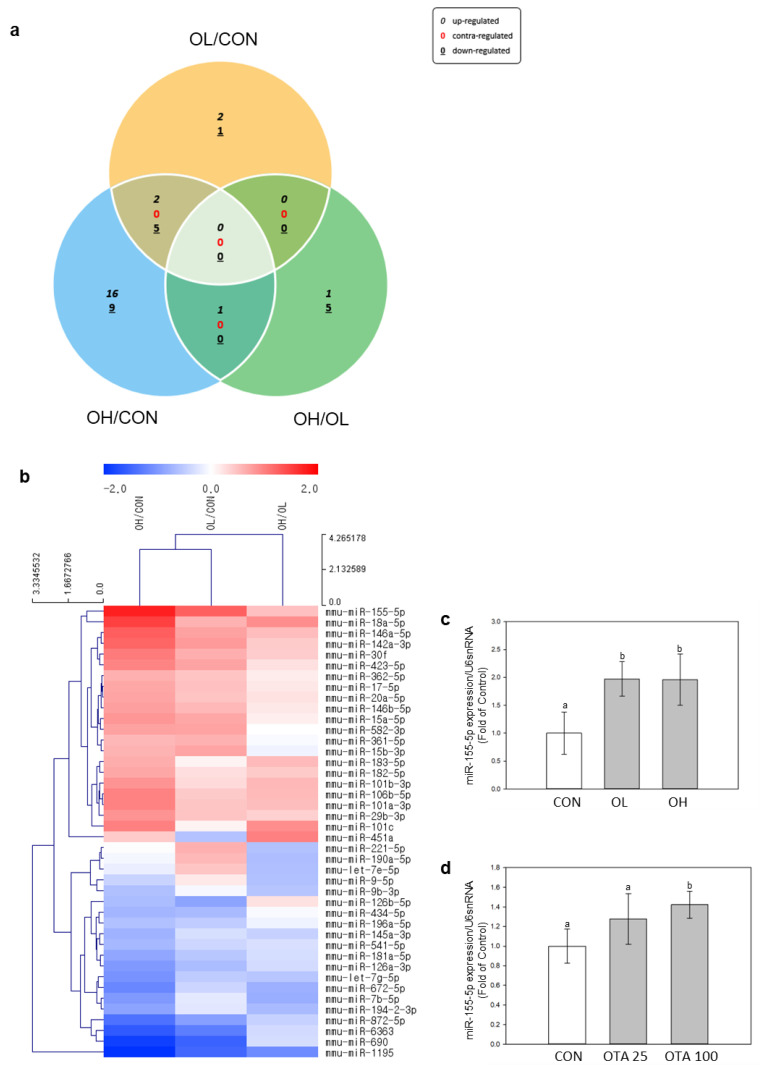
Figure 4.
Identification of transcriptomes by next generation sequencing (NGS) in mice colon tissues exposed to OTA. Expression patterns of DEMs were expressed in (a) Venn diagrams and (b) heatmaps. Venn diagrams indicated overlapping DEMs by pairwise comparisons OL/CON, OH/CON, and OL/OH. DEM heatmaps were displayed as red for upregulated miRNAs and blue for downregulated miRNAs of pairwise comparison between OL/CON, OH/CON, and OL/OH. The DEMs were aligned to decreasing order of fold change. All DEMs in the heatmap analysis showed a 1.5-fold change in cut-off values, p < 0.05. Validation of miRNA NGS analysis of miR-155-5p in (c) mice colon tissues and (d) Caco-2 cells were performed by measuring miR-155-5p expressions using real-time qPCR. The expressions of miR-155-5p were normalized by U6 snRNA expression. Data represent the mean ± S.D. of experiments with triplicate samples, and significance was determined by comparing with the control using Tukey’s studentized range test; different letters mean significant differences at p < 0.05.

