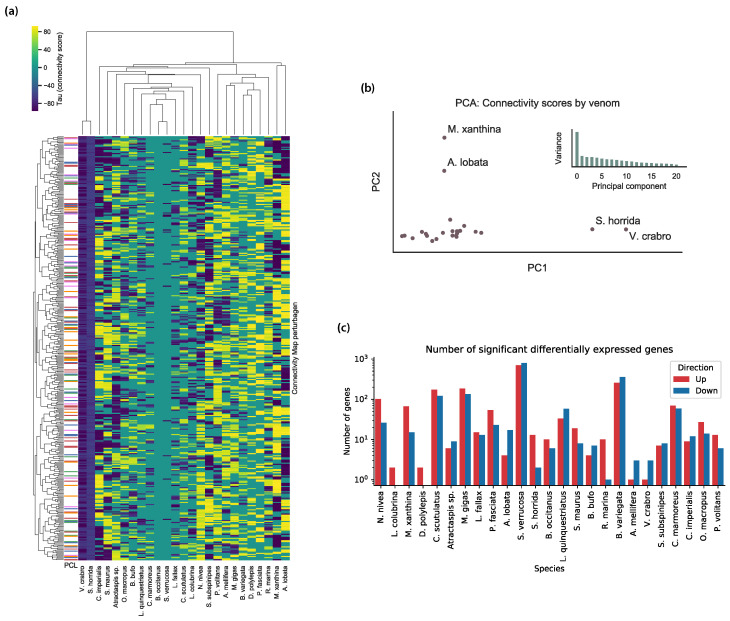
Figure 3.
Connectivity analysis results. (a) Heatmap of -scores between the 25 venom perturbations and the 500 Connectivity Map signatures with the highest variance across all venoms. A distinct hierarchical clustering pattern is evident across the venom perturbations, although it does not conform to any obvious grouping pattern of the venoms. (b) Principle component analysis of the 25 venom perturbations, where features are all -scores between the venom and signatures from the Connectivity Map reference database. Four distinct outliers are labeled—these venoms correspond to outliers in the heatmap. Also shown are the ratios of variance explained by each of the first 21 principle components—after the first principle component, the distribution is characterized by a long tail, suggesting that much of the variance is spread across many dimensions, underscoring the complexity of the connectivity score data. (c) Barplot showing the number of significant differentially expressed genes for IMR-32 cells exposed to each of the 25 venoms.

