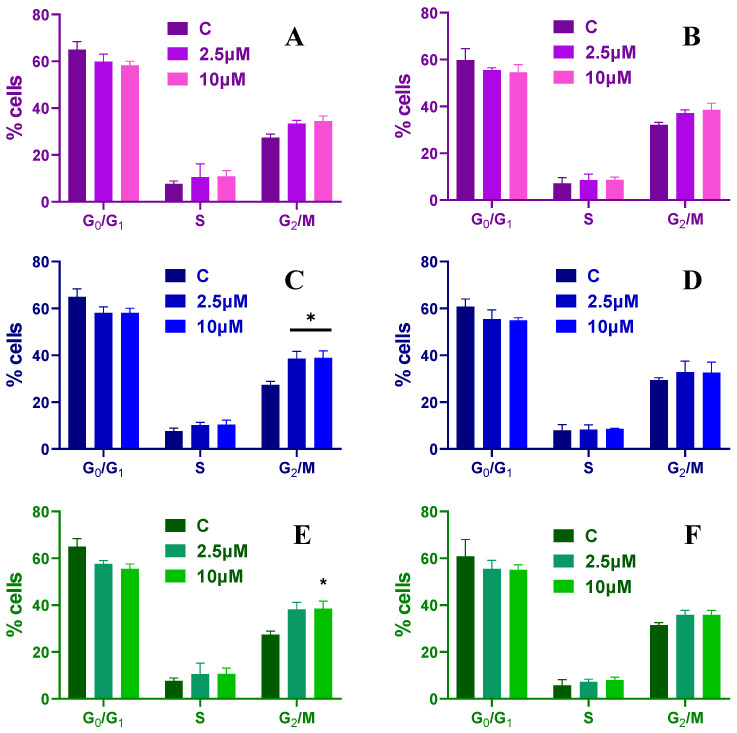
Figure 7.
Cell cycle distribution for HCT-116 spheroids treated with 2.5 and 10 µM of Mel (A,B), CA (C,D) and CA-Mel (E,F) for 24 h (A,C,E) and 48 h (B,D,F). Data are represented as mean ± SD (n = 3). p values were calculated using ANOVA analysis with Tukey’s multiple comparison post-test. * p < 0.5 vs. C.

