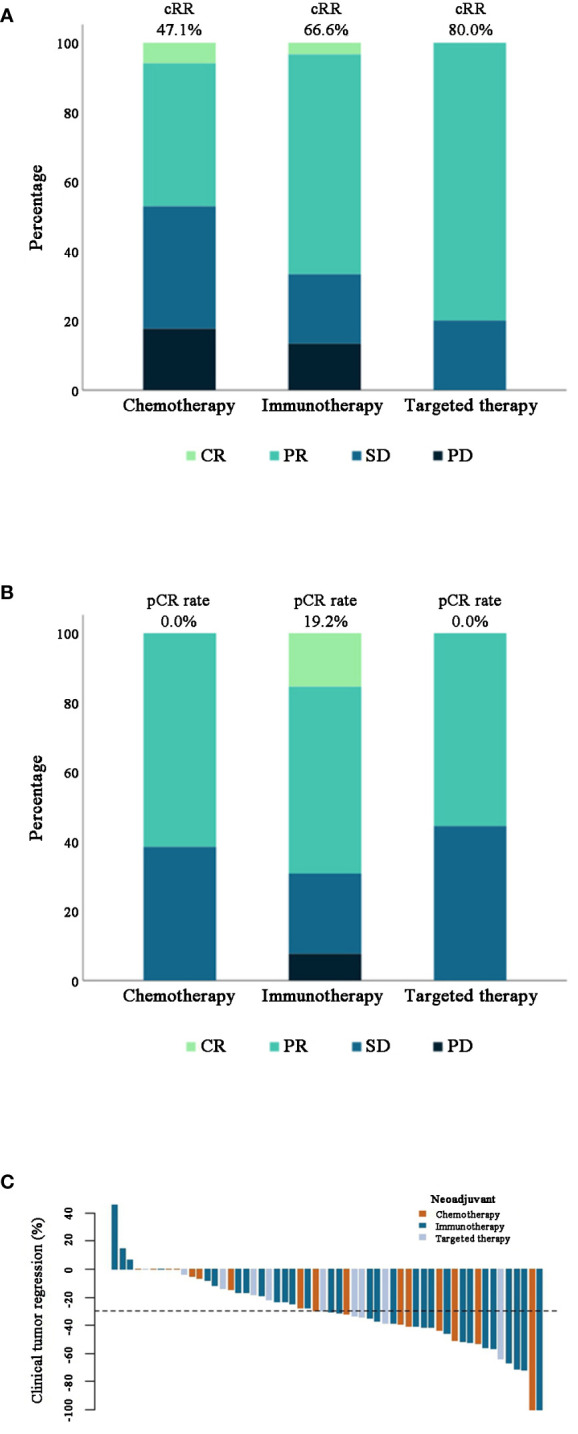
Figure 2.

(A, B) Stacked bar plots of clinical (n=57) and pathological (n=48) response rate of patients in different treatment groups. (C) Waterfall plot of clinical tumor regression percentage after different neoadjuvant therapies in 56 patients. Note: One patient in the chemotherapy group was excluded as mentioned before.
