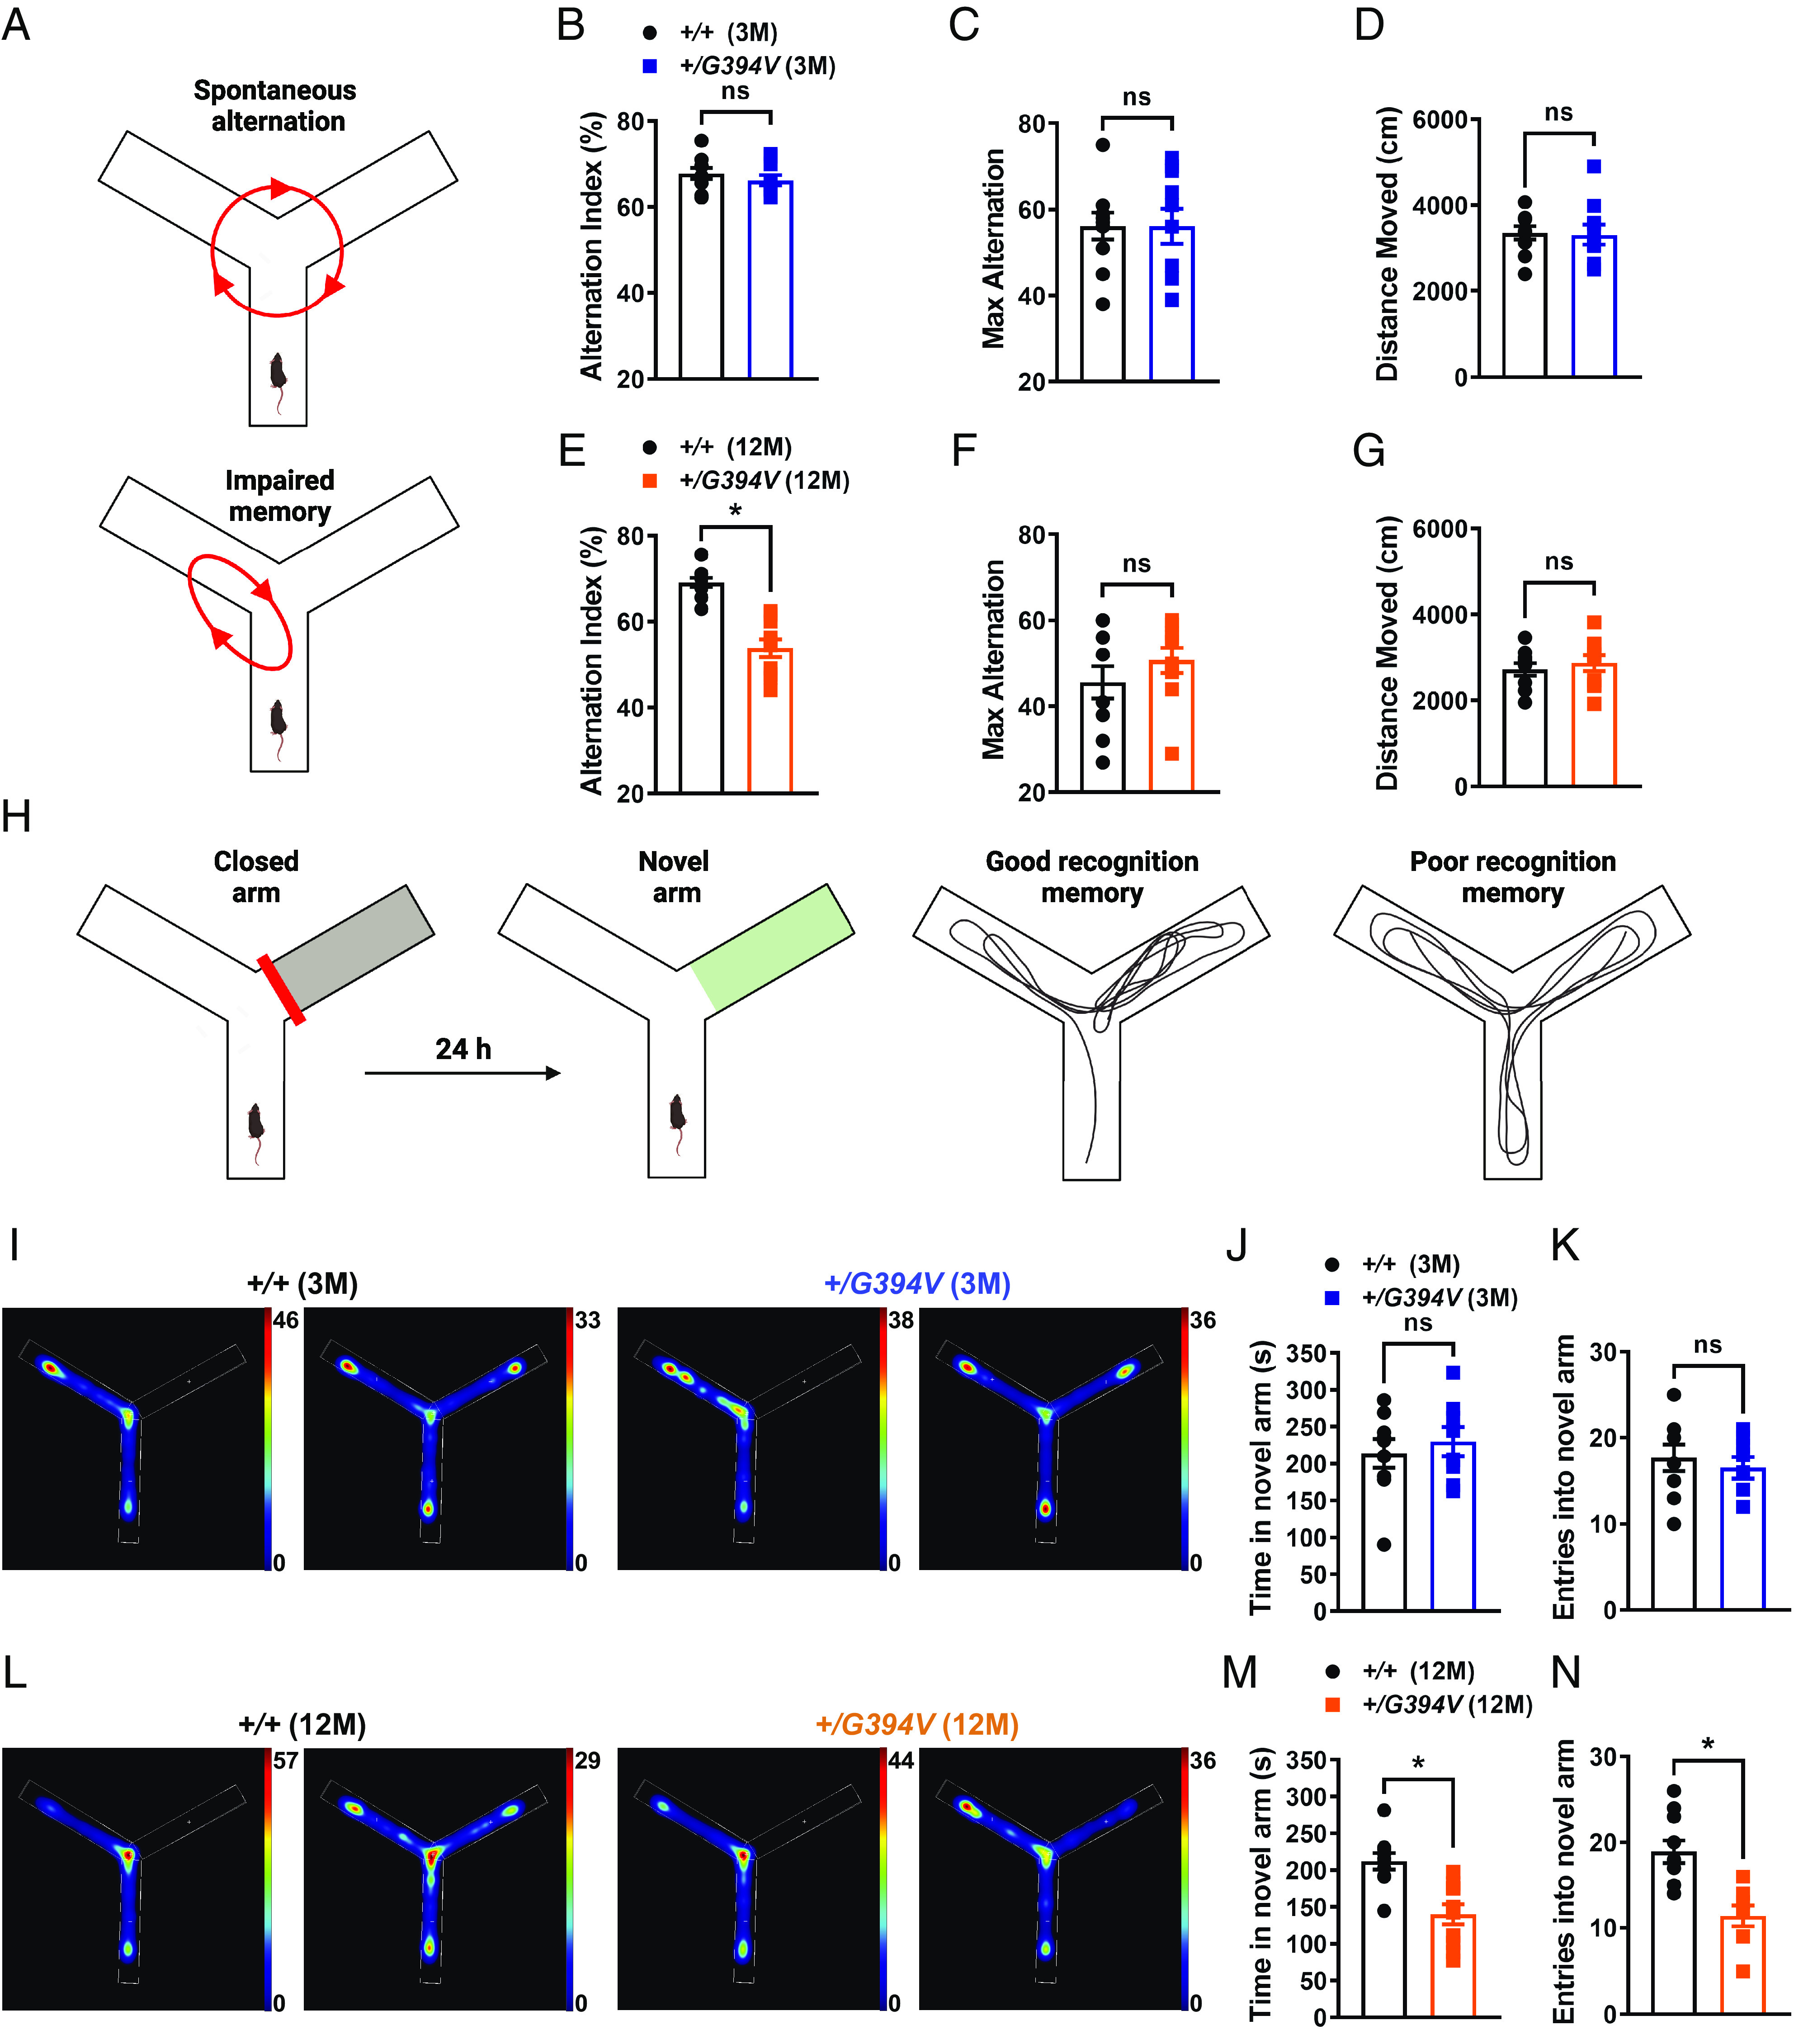
Fig. 3.

Age-dependent memory deficits in Col4a1+/G394V mice. (A) Illustration of the Y-maze spontaneous alternation behavior assay showing examples of a spontaneous (Top) and nonspontaneous (Bottom) alternation. (B) Summary data showing alternation index, an indicator spatial working memory, in 3-M-old Col4a1+/+ and Col4a1+/G394V mice (n = 10 animals per group, ns = not significant, unpaired t test). (C and D) Summary data showing max alternation (C) and distance moved (D), indicative of exploratory activity, in 3-M-old Col4a1+/+ and Col4a1+/G394V mice (n = 10 animals per group, ns = not significant, unpaired t test). (E) Summary data showing the alternation index of 12-M-old Col4a1+/+ and Col4a1+/G394V mice (n = 10 animals per group, *P < 0.05, unpaired t test). (F and G) Summary data showing max alternation (F) and distance moved (G) in 12-M-old Col4a1+/+ and Col4a1+/G394V mice (n = 10 animals per group, ns = not significant, unpaired t test). (H) Illustration demonstrating typical and impaired Y-maze novel arm behavior. (I) Representative heatmaps showing the time (s) 3-M-old Col4a1+/+ and Col4a1+/G394V mice spent in areas of the Y-maze during the novel arm test. (J and K) Summary data showing the time spent (J) and entries (K) into the novel arm (n = 8 to 9 animals per group, ns = not significant, unpaired t test). (L) Representative heatmaps showing the time (s) 12-M-old Col4a1+/+ and Col4a1+/G394V mice spent in areas of the Y-maze during the novel arm test. (M and N) Summary data showing the time spent (M) and entries (N) into the novel arm (n = 10 animals per group, *P < 0.05, unpaired t-test).
