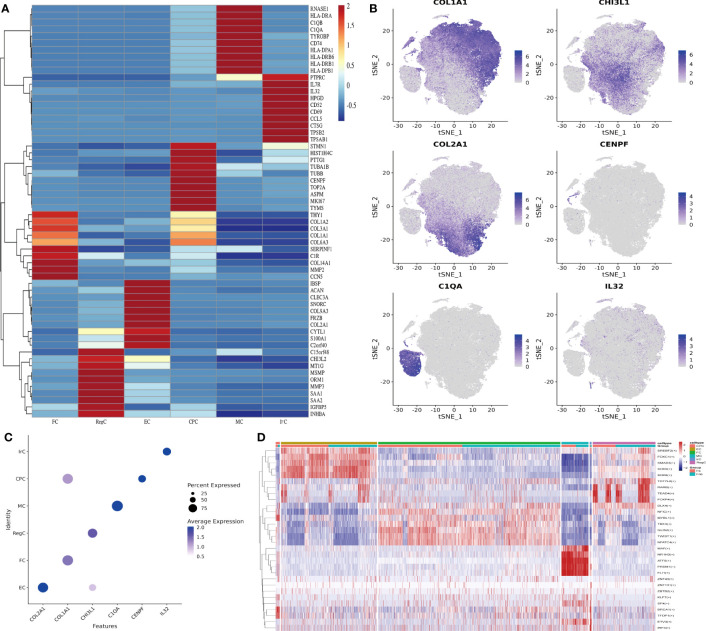
Figure 2.
Identification of chondrocyte subpopulations. (A) Heatmap revealing the scaled expression of differentially expressed genes for each cell type. Specific representative genes in each chondrocyte subset were highlighted along the right margin. The color scheme is based on z-scores. (B) Clustering plots of Marker genes in cell subpopulations. (C) DotPlot of cell Marker genes. (D) Differences in transcription factor expression between different groups and cell types, with colors indicating transcription factor AUC values in different cells. Fb, femur weight-bearing region; Fnb, femur non-weight-bearing region. CPC, cartilage progenitor cells; EC, effector chondrocyte; FC, fibrocartilage chondrocyte; IrC, inflammatory related chondrocyte; MC, macrophage chondrocyte; RegC, regulatory chondrocyte; RA, rheumatoid arthritis; t-SNE, t-distributed stochastic neighbor embedding.

