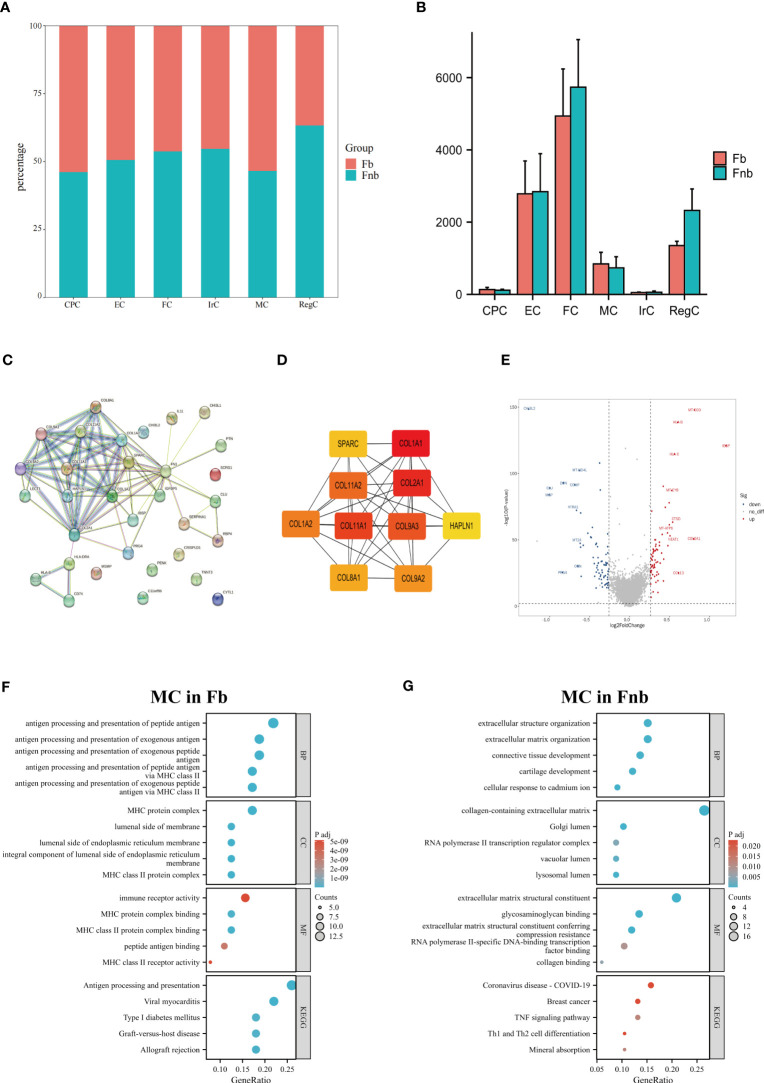
Figure 5.
Results of differences analysis between Fb and Fnb. (A) Differences in the proportion of cell subpopulations. (B) Differences in the number of cell subpopulations. (C) The PPI network constructed by the String tool. Nodes represented proteins produced by protein-coding genes, and connections between nodes represented predicted protein interactions. (D) The top 10 Hub genes predicted by Cytoscape. (E) Volcano plot of MC DEGs between Fb and Fnb groups. The horizontal coordinate in the plot represented logFC and the vertical coordinate represented p-values. (F–G) Results of GO and KEGG enrichment analysis of MC between Fb and Fnb groups. The size of the circle indicated the number of enriched DEGs and the color represented the p-value. Fb, femur weight-bearing region; Fnb, femur non-weight-bearing region; GO, gene ontology; CPC, cartilage progenitor cells; EC, effector chondrocyte; FC, fibrocartilage chondrocyte; IrC, inflammatory related chondrocyte; MC, macrophage chondrocyte; RegC, regulatory chondrocyte.

