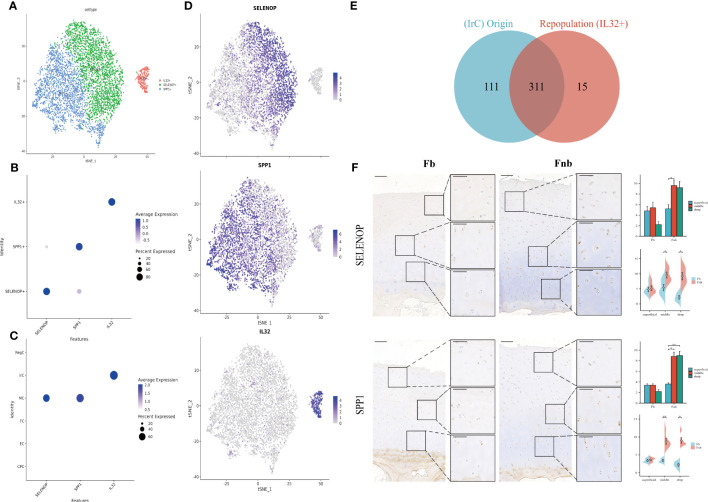
Figure 6.
Marker genes for Immune-related chondrocytes. (A) Clustering plot of three cell subpopulations. (B, C) DotPlot of the cell marker genes. (D) A scatter plot of the cell marker genes, with the color of the dots representing expression levels. (E) Venn diagram for cell ID comparison of IrC and IL32+. The overlap represented the number of repetitive cells in the subpopulation. (F) IHC results for marker genes in different groups and layers. Scale bar, left, 200 µm; right, 100 µm. The scores of the indicated genes in the cartilage of both regions based on the immunohistochemistry assay are shown. *p<0.05, **p<0.01; otherwise, not significant. CPC, cartilage progenitor cells; EC, effector chondrocyte; FC, fibrocartilage chondrocyte; IrC, inflammatory-related chondrocyte; MC, macrophage chondrocyte; RegC, regulatory chondrocyte.

