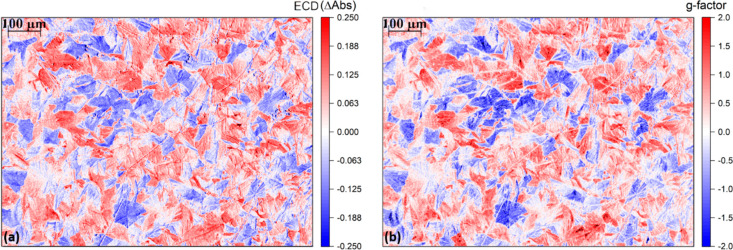
Figure 5.
(a) ECD image of the area of interest of (S,S)-PTPO 2 thin film. Domains with AbsL > AbsR (red) can be clearly distinguished from domains with AbsR > AbsL (blue). (b) g-factor image of the same area. The g-factor, in the case of some of the distinguishable domains, is reaching values close to theoretical maximum absolute value of 2.

