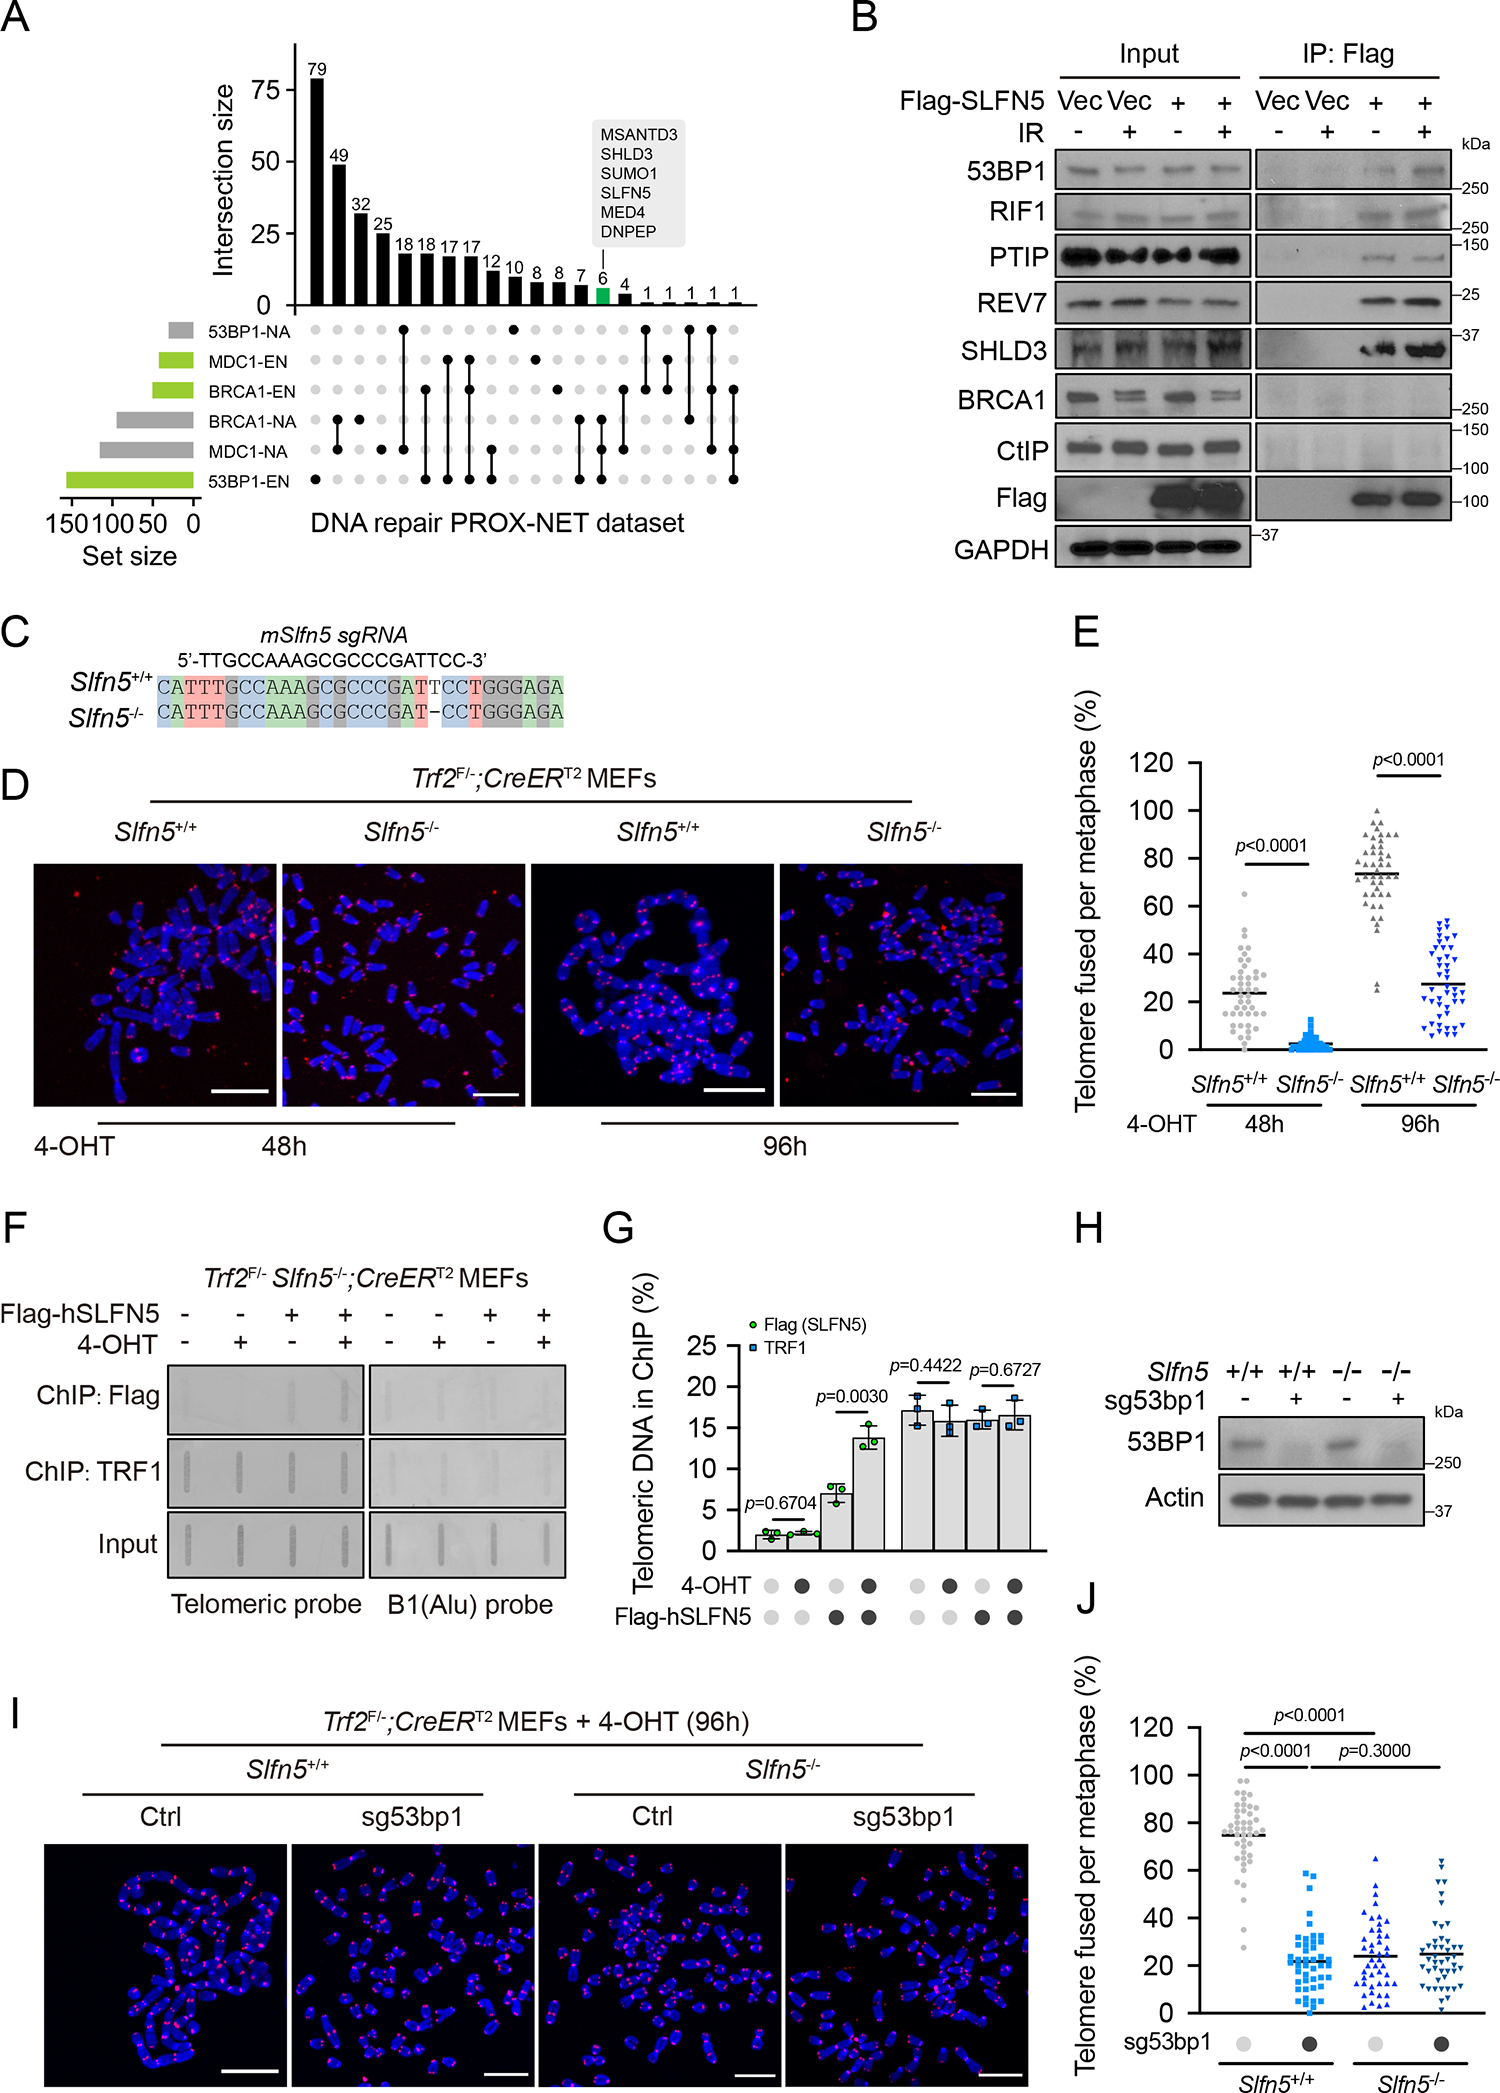
Figure 1. SLFN5 promotes telomere-mediated fusions.

(A) UpSet plot shows the intersection of significant proximal proteins in the PROX-NET dataset of 53BP1, BRCA1, and MDC116. Horizontal bars show the set of proteins with (EN, the log2[bait/control] was ≥ 1 in six independent replicates) or without (NA, not detected in six independent replicates) enrichment of 53BP1, BRCA1, and MDC1 neighborhood networks. Connected lines represent shared proteins between sets. Bar graphs show intersection sizes. A full list is provided in Table S1.
(B) HEK293T cells transfected with empty vector (Vec) or Flag-SLFN5 were untreated or irradiated (5 Gy, 1 h). Cell lysates were immunoprecipitated with Flag beads and blotted with indicated antibodies.
(C) DNA sequencing showed that Slfn5 KO Trf2F/−; CreERT2 MEFs have a frameshift mutation at the CRISPR-Cas9 targeted site.
(D) The indicated Trf2F/−; CreERT2 MEFs were treated with 4-hydroxytamoxifen (4-OHT) for the indicated times. Metaphase spreads were stained by telomeric fluorescence in situ hybridization (FISH) and assessed for telomere fusion. Telomeres and DNA were stained with PNA probe (red) and DAPI (blue), respectively. Representative images are shown in (D). Scale bars, 10 μm.
(E) Telomere fusion quantification from (D). Each dot represents an individual metaphase cell, and the center line indicates the mean; per condition. Data are representative of three independent experiments.
(F) Trf2F/− Slfn5−/−; CreERT2 MEFs stably expressing Vec or Flag-human SLFN5 were treated with MeOH or 4-OHT for 70 h. Flag-SLFN5 and TRF1 accumulation at deprotected telomeres was detected by ChIP. Input, 12.5% of the input DNA. Slot blots were hybridized with telomeric or B1 probes.
(G) Telomere ChIP quantification from (F). Signals were normalized to input. Error bars indicate the mean ± SD of four independent experiments.
(H-J) The indicated Trf2F/−; CreERT2 MEFs were treated with 4-OHT for 96 h. Metaphase spreads were assessed for telomere fusion by telomeric FISH. Telomeres and DNA were stained with PNA probe (red) and DAPI (blue), respectively. The expression level of the indicated proteins was assessed by western blot (H). Representative images are shown in (I). Telomere fusion quantification is shown in (J). Each dot represents an individual metaphase cell, and the center line indicates the mean; per condition. Data are representative of three independent experiments. Scale bars, 10 μm.
p values calculated with two-tailed unpaired t tests.
