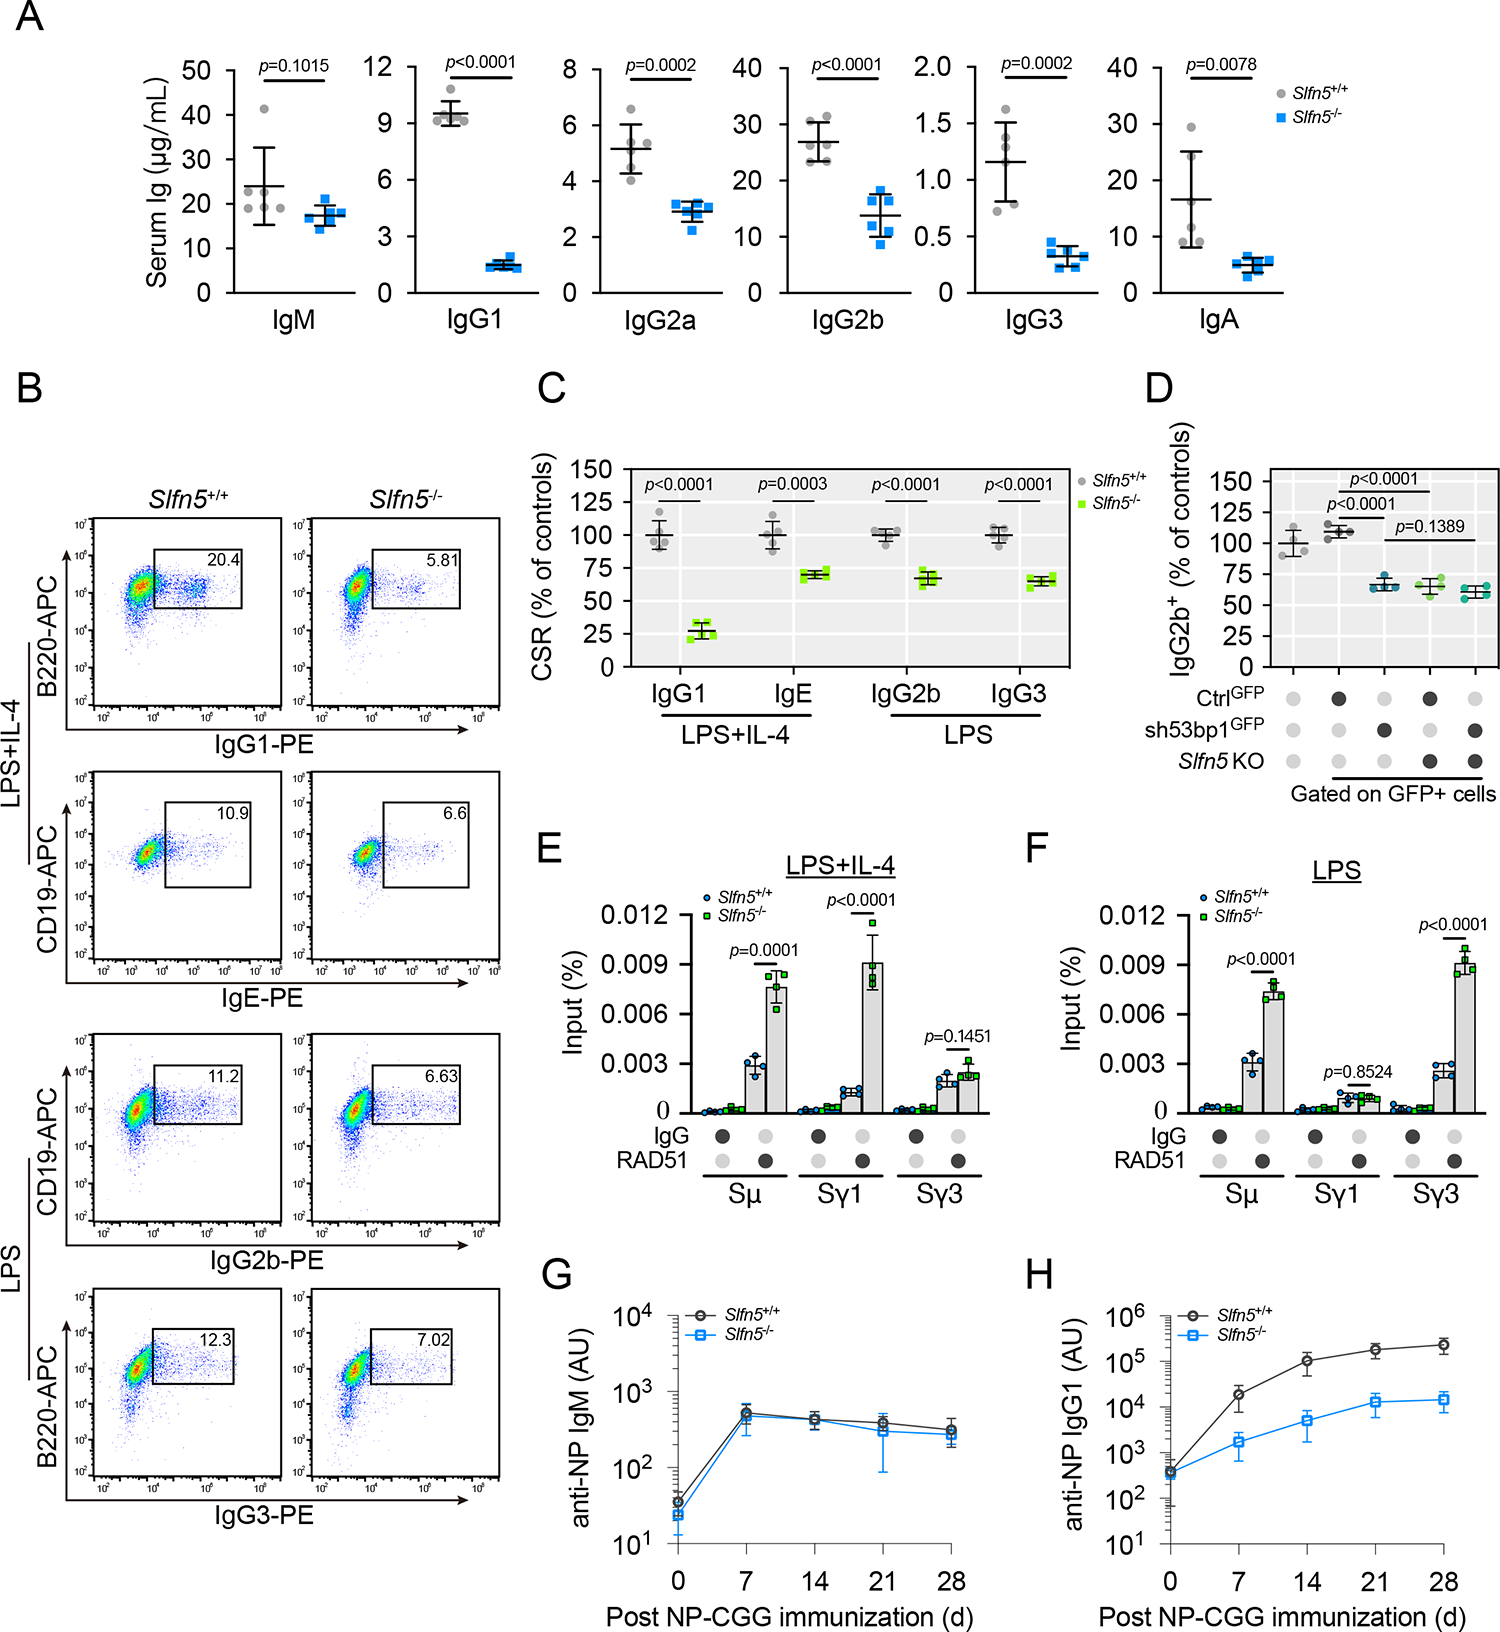
Figure 2. Slfn5−/− mice exhibit defective CSR.

(A) Quantification of serum immunoglobulin from Slfn5+/+ and Slfn5−/− mice. mice per genotype. Error bars indicate mean ± SD.
(B and C) Slfn5+/+ and Slfn5−/− splenic B cells were cultured with the indicated stimuli for 96 h and stained for surface IgG1, IgE, IgG2b, and IgG3. Representative plots of flow cytometry (FACS) are shown in (B). Quantification of CSR percentage for indicated isotypes is shown in (C). mice per genotype. Error bars indicate mean ± SD.
(D) Slfn5+/+ and Slfn5−/− splenic B cells transduced with control-GFP (CtrlGFP) or 53bp1 shRNA-GFP (sh53bp1GFP) were cultured in the presence of lipopolysaccharides (LPS) for 96 h. Transduced cells were stained for IgG2b and analyzed by FACS. IgG2b quantification is shown in (D). Slfn5+/+ splenic B cell were included as a control. mice per genotype. Error bars indicate mean ± SD.
(E and F) Slfn5+/+ and Slfn5−/− splenic B cells were cultured in the presence of LPS + IL-4 (E) or LPS (F) for 96 h. RAD51 accumulation at the CSR-targeted S region DNA sites was detected by ChIP-qPCR. Error bars indicate the mean ± SD of four independent experiments.
(G and H) Slfn5+/+ and Slfn5−/− mice were immunized with 4-hydroxy-3-nitrophenyl)acetyl-chicken γ-globulin (NP-CGG), and NP-specific serum IgM (G) and IgG1 (H) were measured at indicated times after immunization. mice per genotype. Error bars indicate mean ± SD.
p values calculated with two-tailed unpaired t tests.
