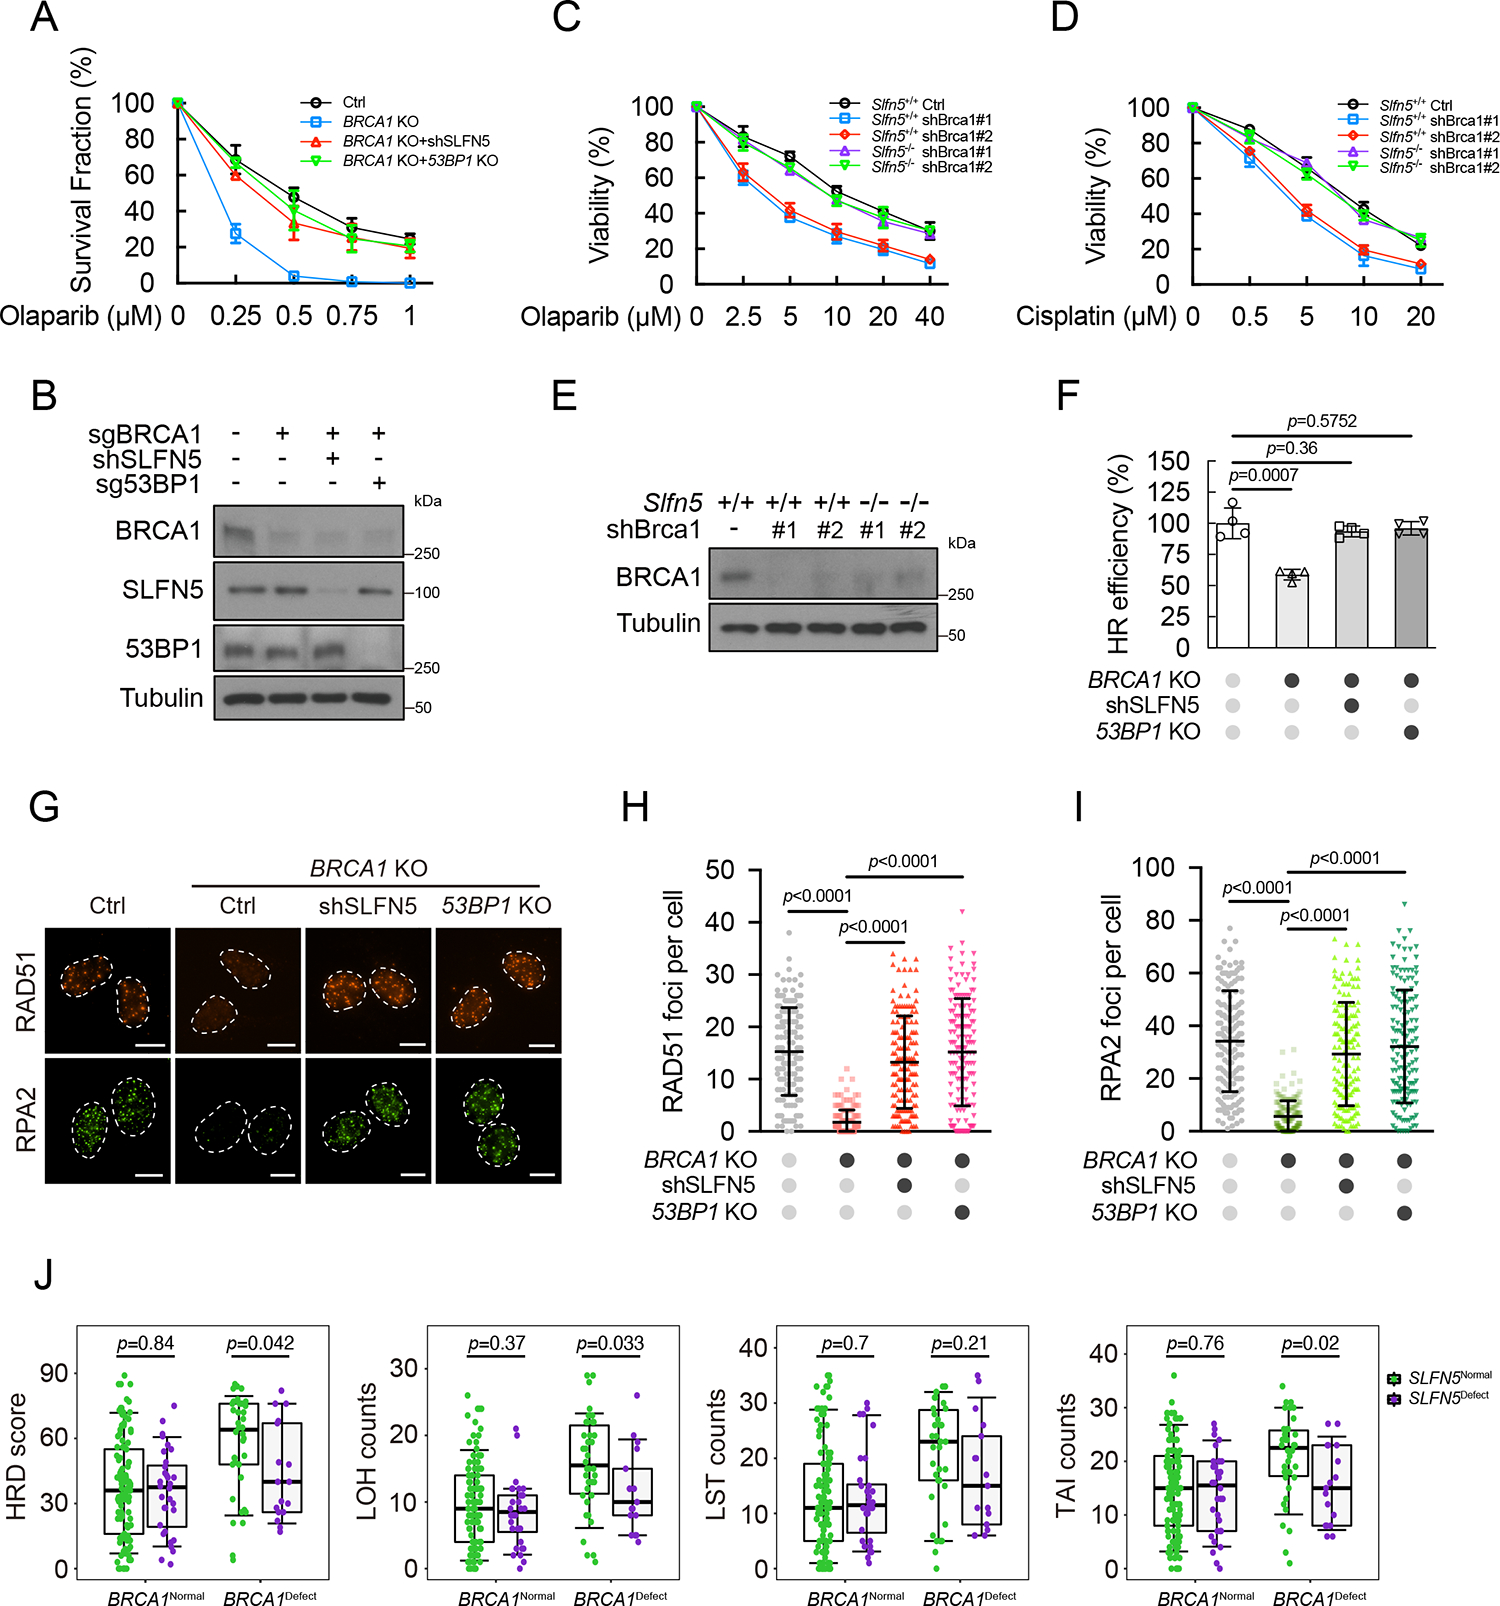
Figure 3. SLFN5 loss promotes PARPi resistance in BRCA1-deficient tumors.

(A and B) The indicated U2OS cells were subjected to colony formation assays to assess olaparib sensitivity (A). Error bars indicate the mean ± SD of three independent experiments. The expression level of the indicated proteins was assessed by western blot (B).
(C-E) Survival assays for Slfn5+/+ and Slfn5−/− MEFs (with or without Brca1 knockdown) exposed to olaparib (C) or cisplatin (D). Error bars indicate the mean ± SD of six independent experiments. The expression level of the indicated proteins was assessed by western blot (E).
(F) Cells from (A) were subjected to a reporter assay to assess the efficiency of HR. Error bars indicate the mean ± SD of four independent experiments.
(G-I) Cells from (A) were exposed to irradiation (2 Gy, 4 h), and the indicated foci were detected by immunofluorescence. Representative images are shown in (G). Quantification of focus numbers is shown in (H and I). Each dot represents a single cell; per condition. Error bars indicate mean ± SD. Data are representative of three independent experiments. Scale bars, 10 μm.
(J) Analysis of HR deficiency (HRD) scores and loss of heterozygosity (LOH), large-scale transitions (LSTs), and telomeric allelic imbalance (TAI) counts in triple-negative breast cancer samples from TCGA. Each dot represents an individual sample, the center line represents the median, the box limits at 25th and 75th centiles, and the whiskers indicate ± 1.5× interquartile range; distinct patients.
p values calculated with two-tailed unpaired t tests (F, H, and I) or two-tailed Mann-Whitney U tests (J).
