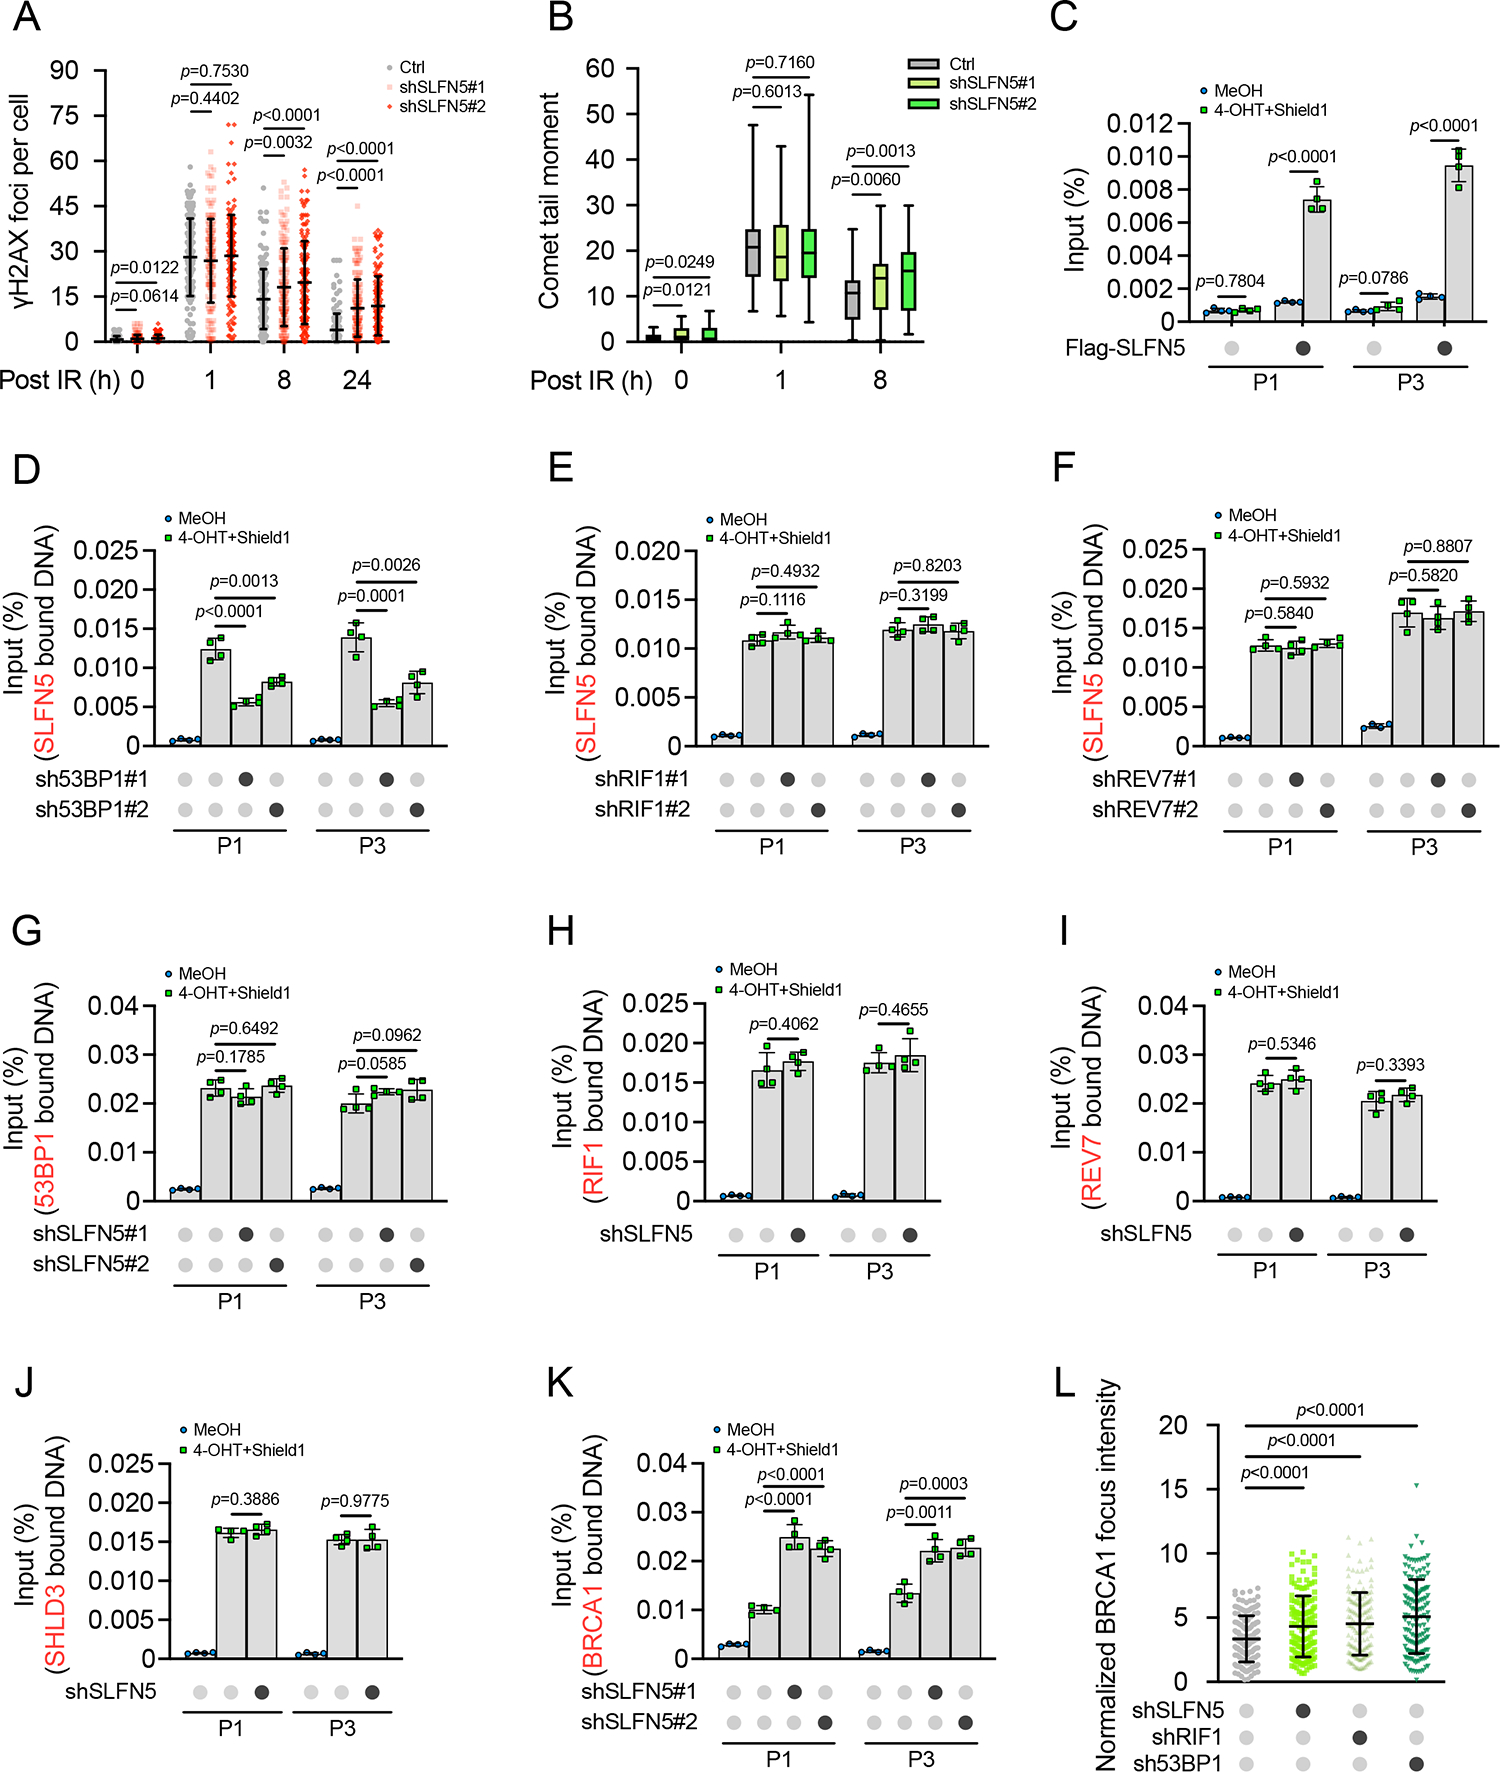
Figure 4. SLFN5 accumulates at DSB sites and functions downstream of 53BP1.

(A) Control (Ctrl) or SLFN5 knockdown U2OS cells were irradiated (2 Gy) for the indicated times. γH2AX foci were detected by immunofluorescence. Quantification of γH2AX focus numbers is shown in (A). Each dot represents a single cell; per condition. Error bars indicate mean ± SD. Data are representative of three independent experiments. Representative images are shown in Figure S3A.
(B) Quantification of tail moments from ctrl or SLFN5 knockdown U2OS cells that were irradiated (5 Gy) for the indicated times. Cells were harvested and subjected to neutral comet assay. The center line represents the median, the box limits at 25th and 75th centiles, and the whiskers indicate the minimum and maximum values; per condition. Data are representative of three independent experiments. Representative images are shown in Figure S3F.
(C) U2OS-FokI cells transfected with Vec or Flag-SLFN5 were treated with 4-OHT and Shield1 for 4 h. Flag-SLFN5 accumulation at DSB sites generated by FokI was detected by ChIP-qPCR. Error bars indicate the mean ± SD of four independent experiments.
(D-F) Ctrl or 53BP1 (D), RIF1 (E), or REV7 (F) knockdown U2OS-FokI cells transfected with Flag-SLFN5 were treated with MeOH or 4-OHT + Shield1 for 4 h. Flag-SLFN5 accumulation at DSB sites generated by FokI was detected by ChIP-qPCR. Error bars indicate the mean ± SD of four independent experiments.
(G) Ctrl or SLFN5 knockdown U2OS-FokI cells were treated with MeOH or 4-OHT + Shield1 for 4 h. 53BP1 accumulation at DSB sites generated by FokI was detected by ChIP-qPCR. Error bars indicate the mean ± SD of four independent experiments.
(H-J) Ctrl or SLFN5 knockdown U2OS-FokI cells transfected with Flag-RIF1 (H), SFB-REV7 (I), or SFB-SHLD3 (J) were treated with MeOH or 4-OHT + Shield1 for 4 h. Flag-RIF1 (H), SFB-REV7 (I), or SFB-SHLD3 (J) accumulation at DSB sites generated by FokI was detected by ChIP-qPCR. Error bars indicate the mean ± SD of four independent experiments.
(K) Ctrl or SLFN5 knockdown U2OS-FokI cells were treated with MeOH or 4-OHT + Shield1 for 4 h. BRCA1 accumulation at DSB sites generated by FokI was detected by ChIP-qPCR. Error bars indicate the mean ± SD of four independent experiments.
(L) The indicated U2OS cells were irradiated (2 Gy, 1 h), and the BRCA1 foci were detected by immunofluorescence. Each dot represents a single cell; per condition. Error bars indicate mean ± SD. Data are representative of three independent experiments. Representative images are shown in Figure S4B.
p values calculated with two-tailed unpaired t tests.
