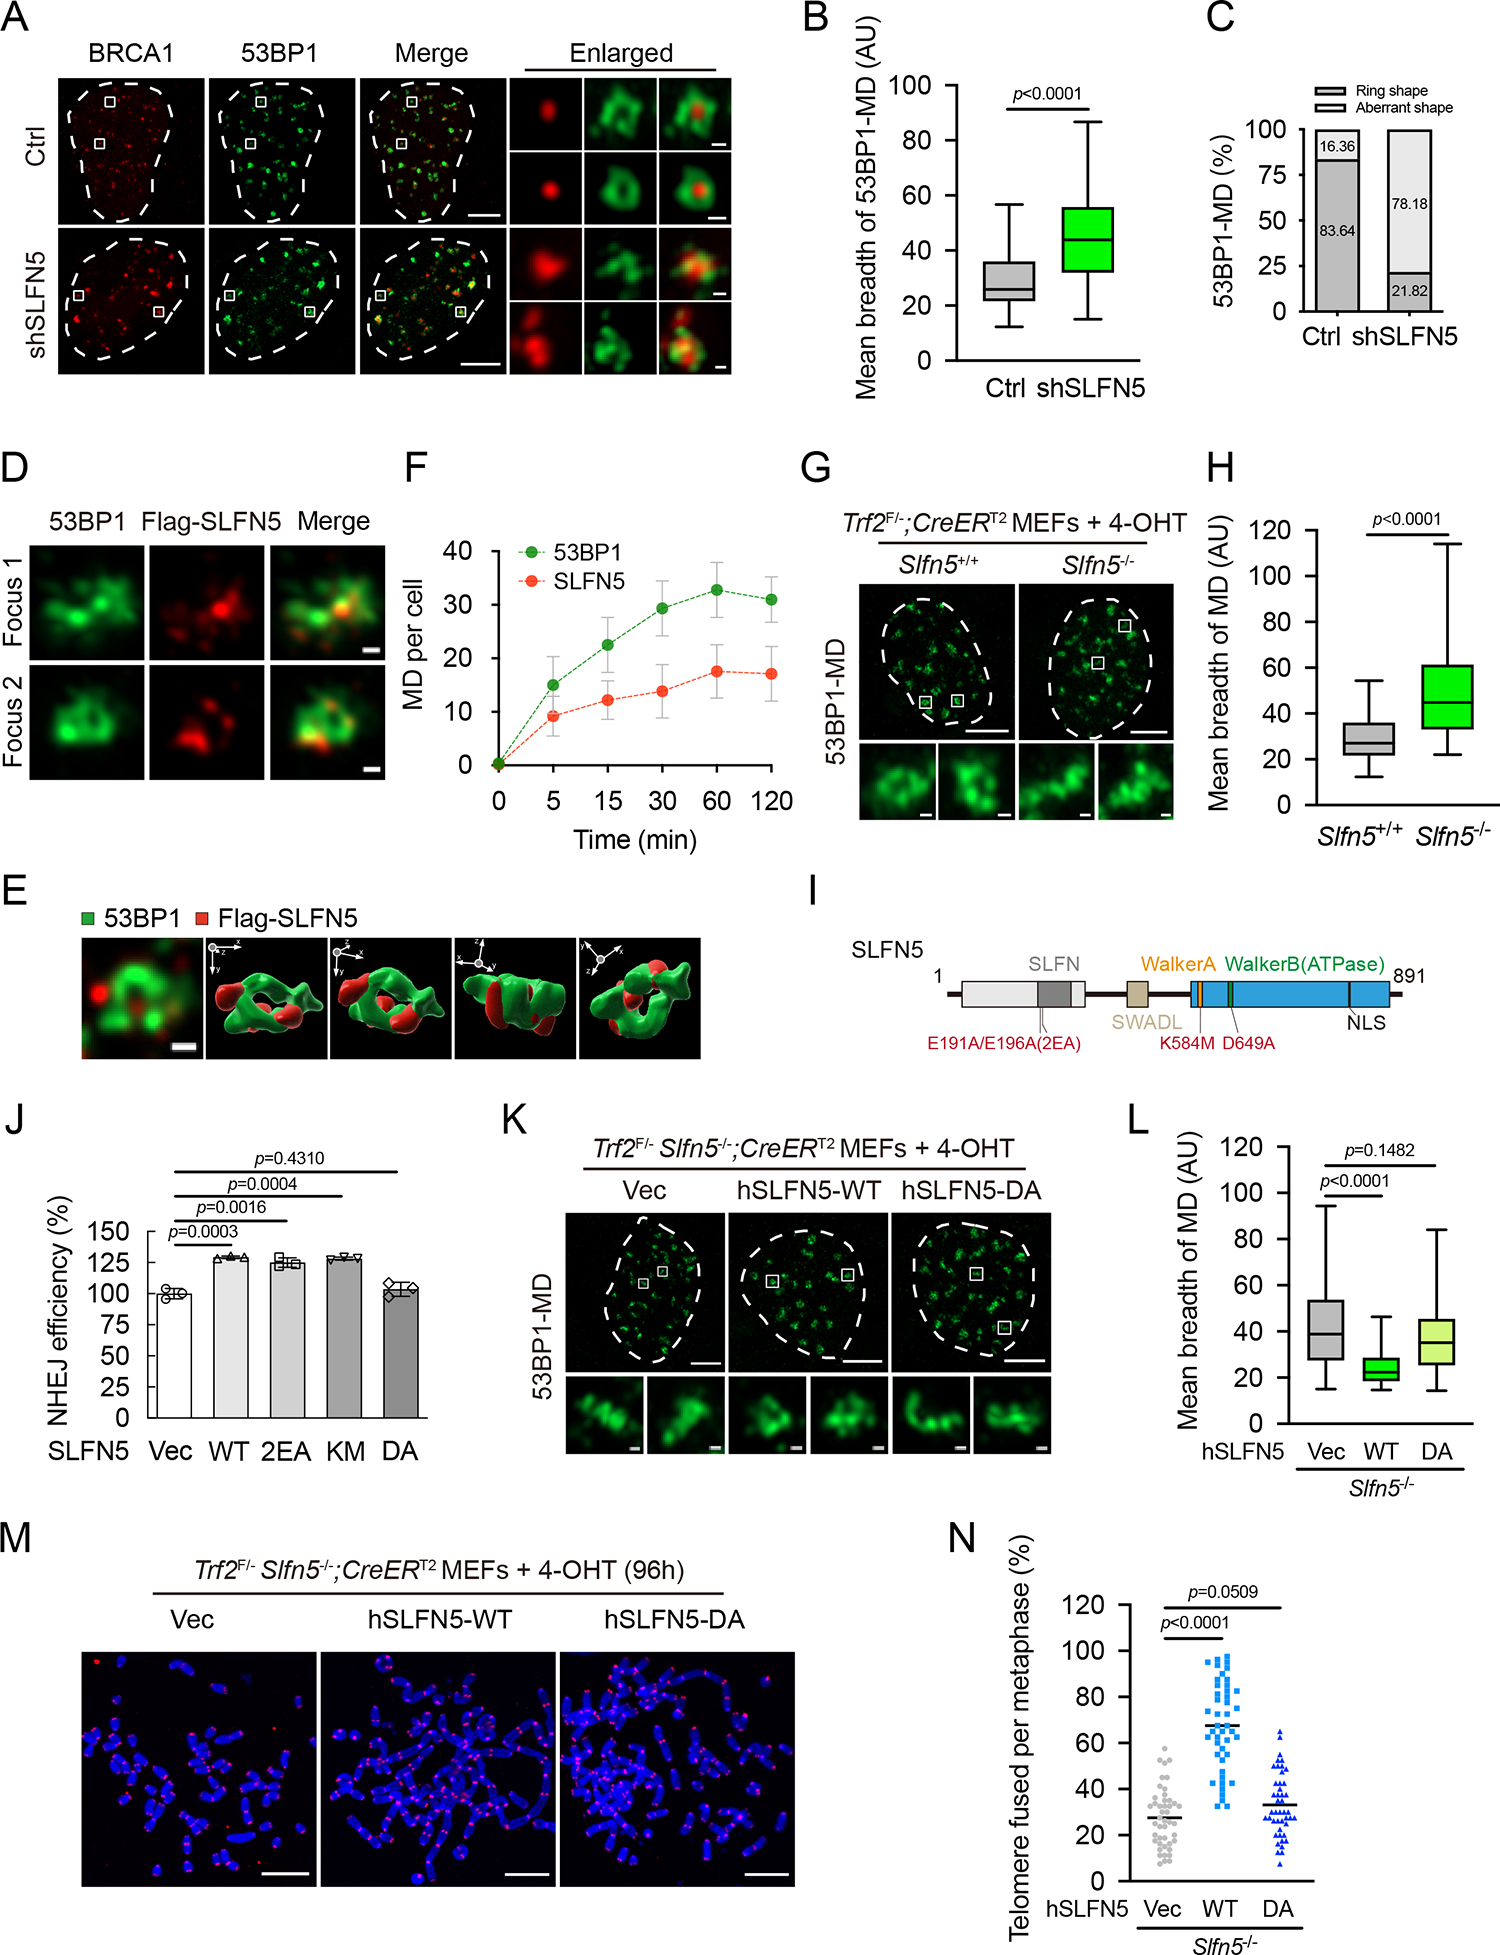
Figure 5. SLFN5 regulates the higher-order chromatin topology of 53BP1.

(A) Ctrl or SLFN5 knockdown U2OS cells were irradiated (2 Gy, 1 h), and the indicated foci were detected by Airyscan2 super-resolution microscope (Airyscan2-SR). Scale bars, 5 μm and 200 nm (insets).
(B) Quantification of the mean breadth of 53BP1 microdomains (53BP1-MDs) from (A) was performed by QUANTEX7. The center line represents the median, the box limits at 25th and 75th centiles, and the whiskers indicate the minimum and maximum values; per condition. Data are representative of three independent experiments.
(C) Quantification of the percentage of ring distribution patterns versus aberrant patterns of 53BP1-MDs from (A). per condition.
(D) U2OS cells stably expressing Flag-SLFN5 were irradiated (2 Gy, 1 h) and subjected to Airyscan2-SR with the indicated antibodies. Foci 1 and 2 are magnified from a large-field-of-view image in Figure S5A. Scale bars, 200 nm.
(E) A representative 3D view of an arrangement of 53BP1-MD with Flag-SLFN5. The 3D image is processed under maximal intensity projection. 3D opacity view is displayed in three orientations indicated by arrows.
(F) U2OS cells stably expressing Flag-SLFN5 were irradiated (2 Gy) for the indicated times and subjected to Airyscan2-SR with the indicated antibodies. Quantification of recruitment of 53BP1 and Flag-SLFN5 to DSB sites is shown in (F). per condition. Error bars indicate mean ± SD. Data are representative of two independent experiments. Representative images for the indicated times are shown in Figure S5.
(G and H) The indicated Trf2F/−; CreERT2 MEFs were treated with 4-OHT for 70 h. The 53BP1-MD signals were detected by Airyscan2-SR. Representative images are shown in (G). Quantification of mean breadth of 53BP1-MDs is shown in (H). The center line represents the median, the box limits at 25th and 75th centiles, and the whiskers indicate the minimum and maximum values; per condition. Data are representative of three independent experiments. Scale bars, 5 μm and 200 nm (insets).
(I) A schematic depiction of SLFN5 wild-type (WT) and its mutants.
(J) HEK293T cells were transfected with Vec, WT, or the indicated mutants of SLFN5 and were subjected to a reporter assay to assess the efficiency of NHEJ. Error bars indicate the mean ± SD of three independent experiments.
(K and L) Trf2F/− Slfn5−/−; CreERT2 MEFs stably expressing Vec, WT, or DA Flag-human SLFN5 were treated with 4-OHT for 70 h. The 53BP1-MD signals were detected by Airyscan2-SR. Representative images are shown in (K). Quantification of the mean breadth of 53BP1-MDs is shown in (L). The center line represents the median, the box limits at 25th and 75th centiles, and the whiskers indicate the minimum and maximum values; per condition. Data are representative of three independent experiments. Scale bars, 5 μm and 200 nm (insets).
(M and N) Trf2F/− Slfn5−/−; CreERT2 MEFs stably expressing Vec or WT or DA Flag-human SLFN5 were treated with 4-OHT for 96 h. Metaphase spreads were stained with Telomeric FISH and assessed for telomere fusion. Telomeres and DNA were stained with PNA probe (red) and DAPI (blue), respectively. Representative images are shown in (M). Quantification of the percentage of telomere fusions is shown in (N). Each dot represents an individual metaphase cell, and the center line indicates the mean; per condition. p values calculated with two-tailed unpaired t tests. Data are representative of three independent experiments. Scale bars, 10 μm.
p values calculated with two-tailed Mann-Whitney U tests (B, H, and L) or two-tailed unpaired t tests (J and N).
