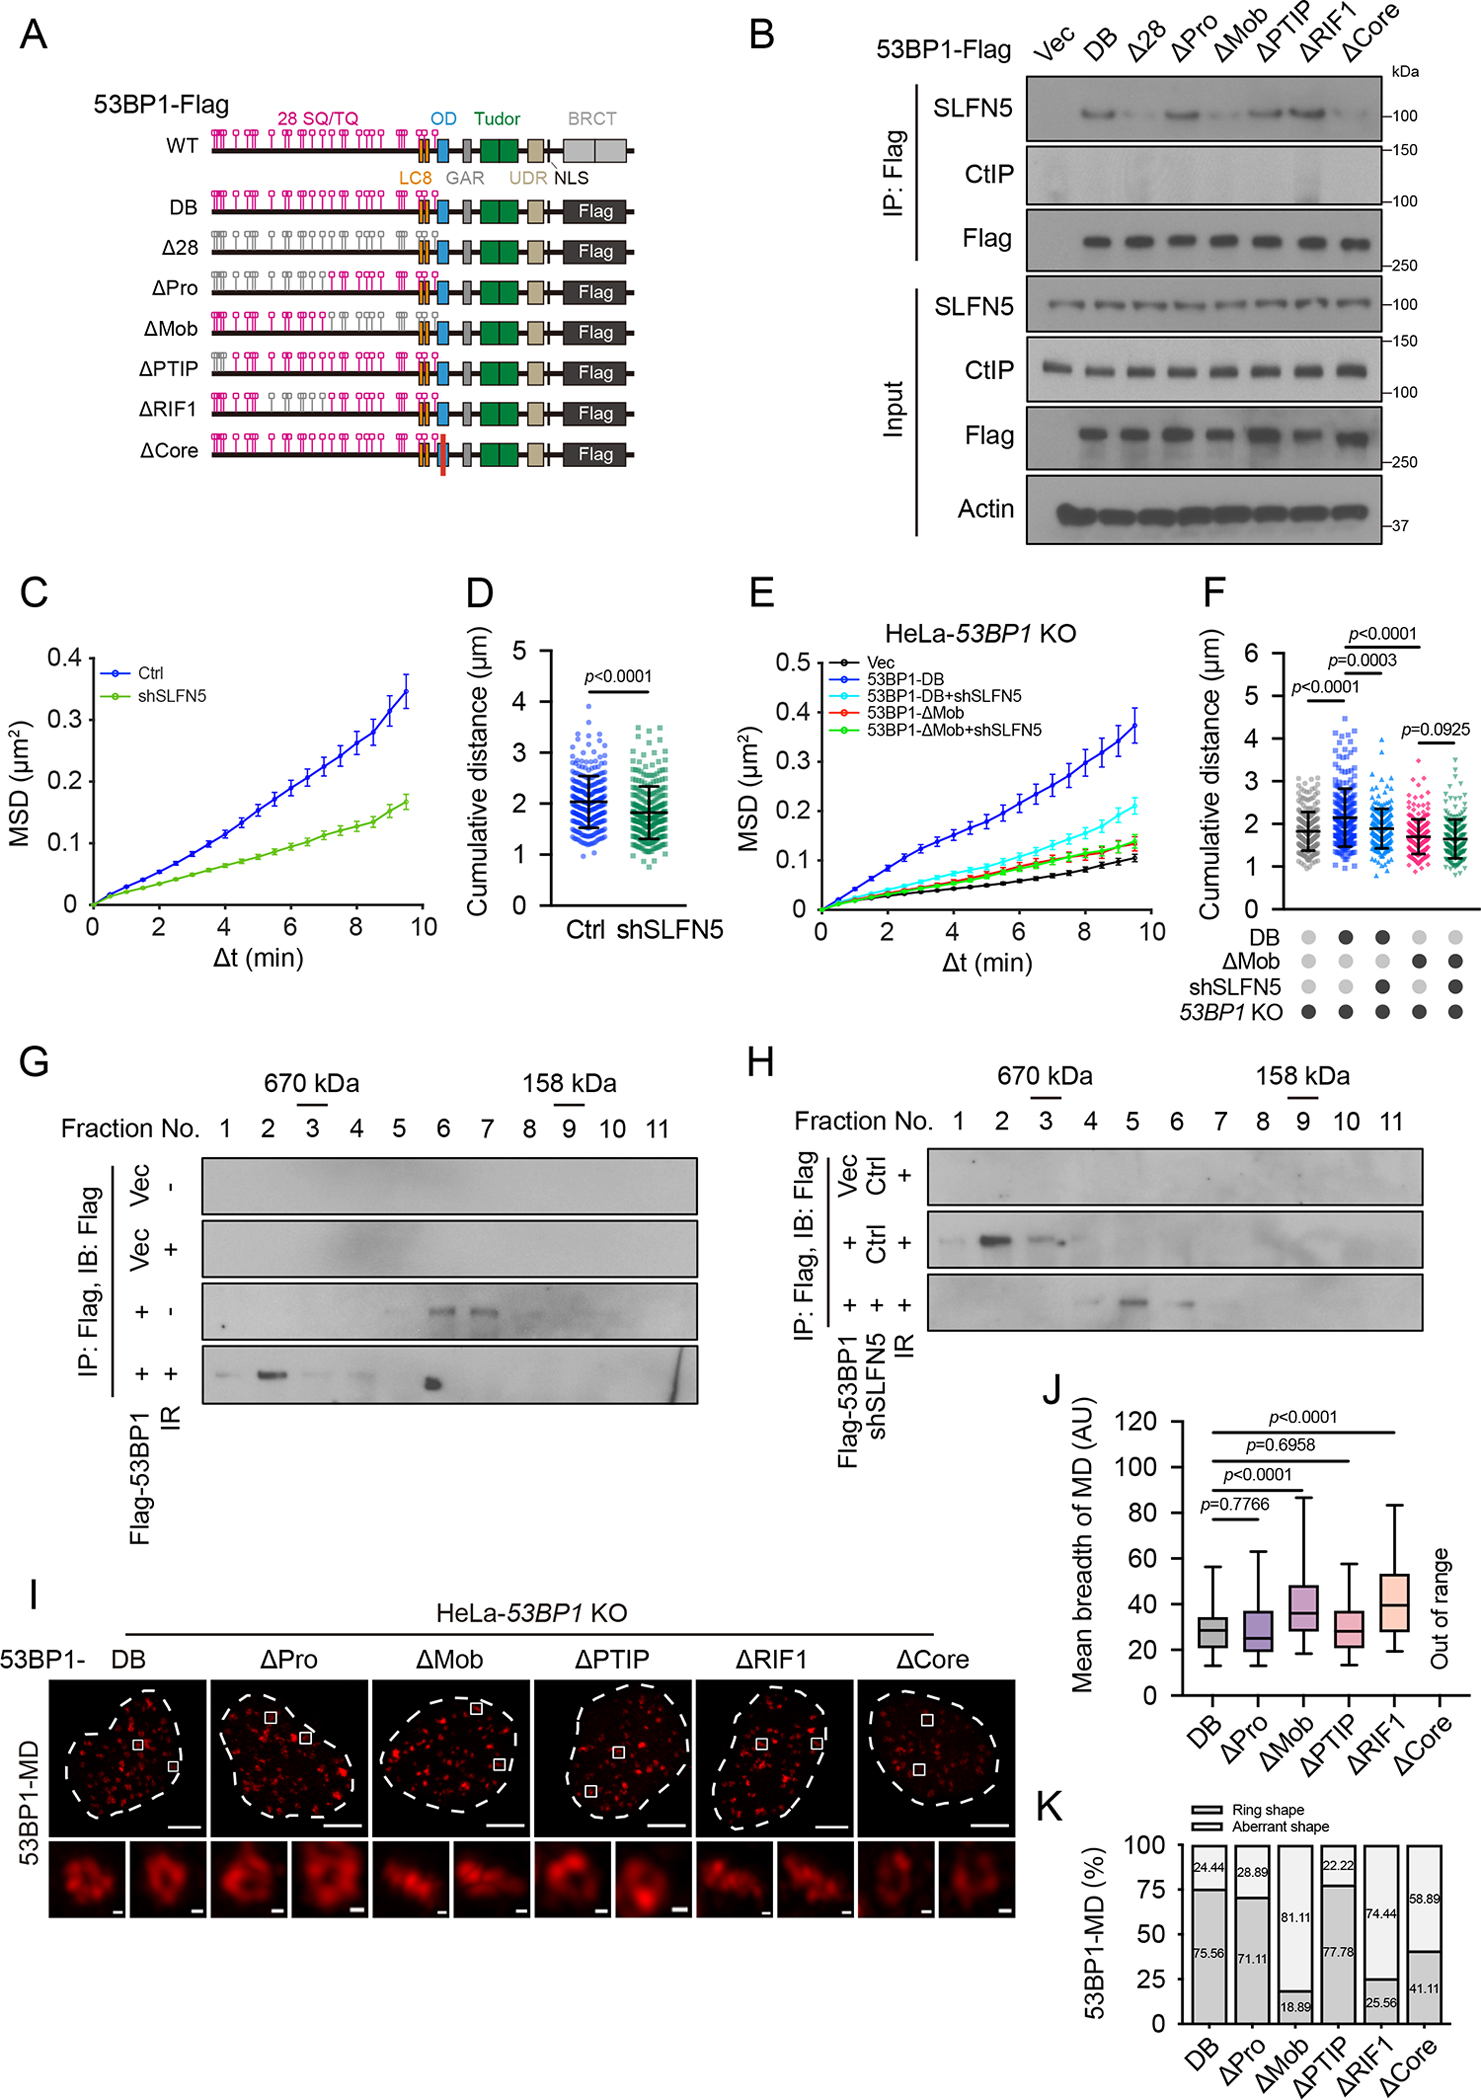
Figure 6. SLFN5 promotes 53BP1-dependent DSB dynamics.

(A) A schematic depiction of 53BP1 mutants.
(B) 53BP1 knockout (KO) 293A cells transfected with the indicated 53BP1-Flag constructs were irradiated (5 Gy, 1 h). Cell lysates were immunoprecipitated with Flag beads and blotted with the indicated antibodies.
(C) Ctrl or SLFN5 knockdown U2OS cells expressing mCherry-BP1-2 were irradiated (2 Gy, 10 min). mCherry-BP1-2 foci were then traced over 10 min via live-cell imaging. Mean square displacement (MSD) analysis of mCherry-BP1-2 foci is shown in (C). Δt, time interval. and 267. Error bars indicate mean ± weighted SD. Data are representative of three independent experiments.
(D) Median cumulative distance traveled by mCherry-BP1-2 foci from (C). Error bars indicate mean ± SD. and 267. Data are representative of three independent experiments.
€ The indicated HeLa cells expressing mCherry-BP1-2 were irradiated (2 Gy, 10 min). mCherry-BP1-2 foci were then traced over 10 min via live-cell imaging. MSD analysis of mCherry-BP1-2 foci is shown in €. Δt, time interval. , 230, 205, 211, and 208. Error bars indicate mean ± weighted SD. Data are representative of three independent experiments.
(F) Median cumulative distance traveled by mCherry-BP1-2 foci from (E). Error bars indicate mean ± SD. , 230, 205, 211, and 208. Data are representative of three independent experiments.
(G) Flag-53BP1 was purified from HEK293T cells untreated or irradiated (5 Gy, 1 h). Samples were fractionated by fast protein liquid chromatography (FPLC) and then immunoblotted with an anti-Flag antibody.
(H) Flag-53BP1 was purified from ctrl or SLFN5 knockdown HEK293T cells after irradiation (5 Gy, 1 h). Samples were fractionated by FPLC and immunoblotted with an anti-Flag antibody.
(I and J) The indicated HeLa cells were exposed to irradiation (2 Gy, 1 h). 53BP1-MD signals were detected by Airyscan2-SR. Representative images are shown in (I). Quantification of the mean breadth of 53BP1-MDs is shown in (J). The center line represents the median, the box limits at 25th and 75th centiles, and the whiskers indicate the minimum and maximum values; per condition. Data are representative of three independent experiments. Scale bars, 5 μm and 200 nm (insets). Out of Range, focus intensity of 53BP1-ΔCore mutant is too weak/discrete (non-continuous) to detect the successive signals.
(K) Quantification of the percentage of ring distribution patterns versus aberrant patterns of 53BP1-MDs from (I). per condition.
p values calculated with two-tailed Mann-Whitney U tests.
