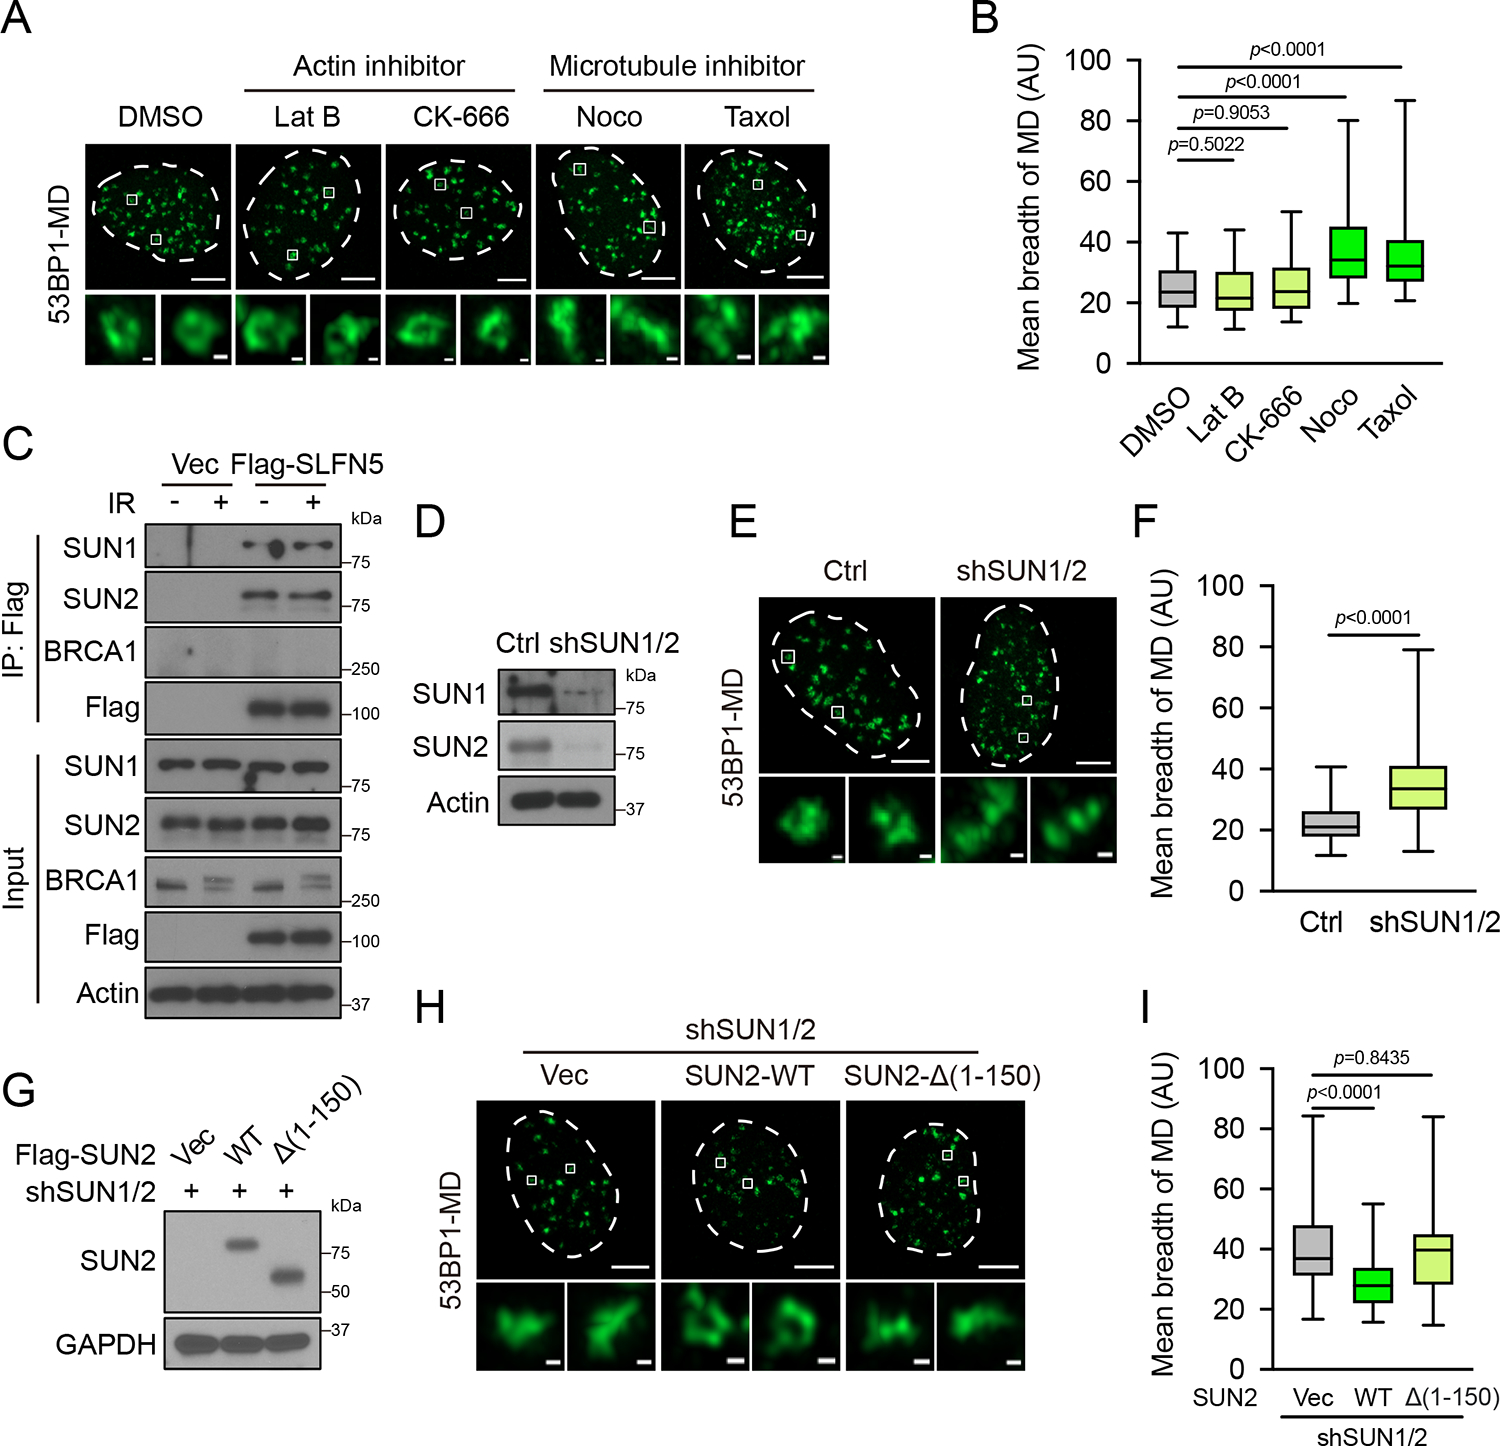
Figure 7. Microtubule-LINC complex mediates the topological arrangement of 53BP1-MDs.

(A and B) U2OS cells were irradiated (2 Gy, 1 h) with Latrunculin B (4 μM), CK-666 (100 μM), Nocodazole (1 μg/mL), or Taxol (20 μM). The 53BP1-MD signals were detected by Airyscan2-SR. Representative images are shown in (A). Quantification of the mean breadth of 53BP1-MDs (B). The center line represents the median, the box limits at 25th and 75th centiles, and the whiskers indicate the minimum and maximum values; per condition. Data are representative of three independent experiments. Scale bars, 5 μm and 200 nm (insets).
(C) HEK293T cells transfected with Vec or Flag-SLFN5 were untreated or irradiated (5 Gy, 1 h). Cell lysates were immunoprecipitated with Flag beads and blotted with the indicated antibodies.
(D-F) Ctrl or SUN1/2 knockdown U2OS cells were irradiated (2 Gy, 1 h). The 53BP1-MD signals were detected by Airyscan2-SR. Immunoblots of the indicated proteins are shown in (D). Representative images are shown in (E). Quantification of the mean breadth of 53BP1-MDs is shown in (F). The center line represents the median, the box limits at 25th and 75th centiles, and the whiskers indicate the minimum and maximum values; per condition. Data are representative of three independent experiments. Scale bars, 5 μm and 200 nm (insets).
(G-I) SUN1/2 knockdown U2OS cells stably expressing Vec, WT, or nucleoplasmic domain mutant Flag-SUN2 were irradiated (2 Gy, 1 h). Immunoblots of the indicated proteins are shown in (G). Representative images are shown in (H). Quantification of the mean breadth of 53BP1-MDs is shown in (I). The center line represents the median, the box limits at 25th and 75th centiles, and the whiskers indicate the minimum and maximum values; per condition. Data are representative of three independent experiments. Scale bars, 5 μm and 200 nm (insets).
p values calculated with two-tailed Mann-Whitney U tests.
