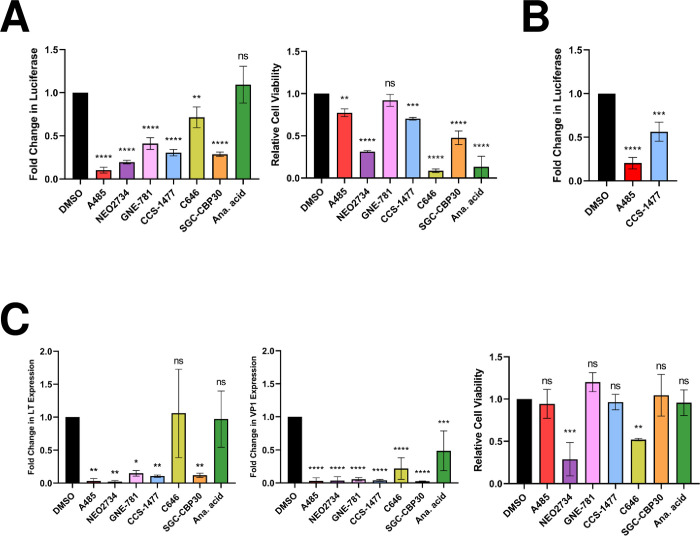
Fig 2. HATi treatment represses MCPyV EP-driven transcription.
(A) HEK293 cells stably expressing an MCPyV EP-luciferase reporter were treated with DMSO, 2 μM A485, 1 μM NEO2734, 1 μM GNE-781, 1 μM CCS-1477, 10 μM C646, 10 μM SGC-CBP30, or 20 μM anacardic acid for 72h, then collected for luciferase or CellTiterGlo 3D assays. (B) HDFs stably expressing an MCPyV EP-luciferase reporter were treated with DMSO, 250 nM A485, or 250 nM CCS-1477 for 72h, then collected for luciferase assays. For both (A) and (B), fold changes in Luciferase were calculated after luciferase readings were normalized to the total protein concentration of each sample. (C) MCPyV-infected HDFs were treated with DMSO, 2 μM A485, 1 μM NEO2734, 1 μM GNE-781, 1 μM CCS-1477, 10 μM C646, 10 μM SGC-CBP30, or 20 μM anacardic acid on day 2 post-infection. Cells were collected on day 5 post-infection for CellTiterGlo 3D assays or RT-qPCR analysis of viral mRNA. RT-qPCR quantifications of viral mRNA expression were normalized to levels of cellular GAPDH mRNA. Error bars represent the standard deviation of three independent experiments. ****p<0.0001; ***p<0.001; **p<0.01; *p<0.05; ns = not significant.

