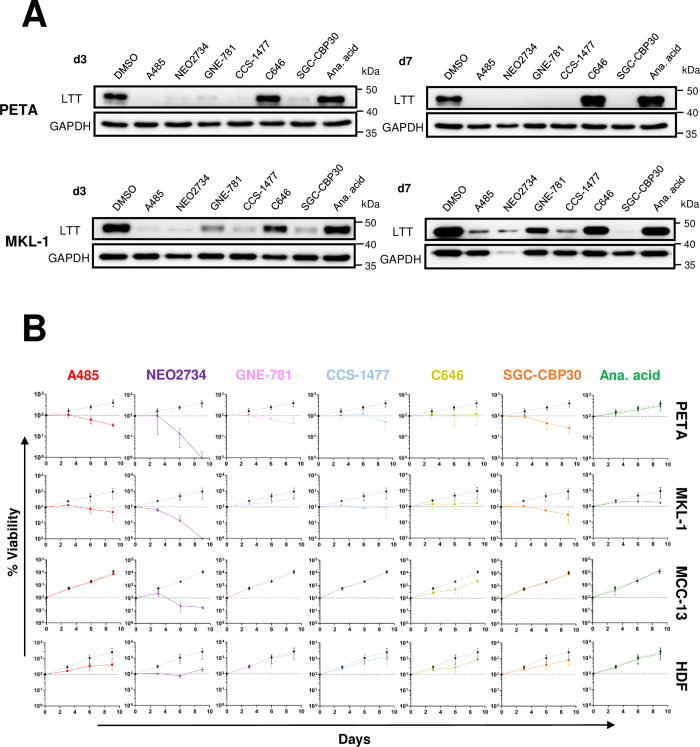
Fig 9. Inhibition of p300/CBP activity represses MCPyV LTT expression to specifically kill MCPyV+ MCC.
(A) PETA and MKL-1 cells were treated with DMSO, 2 μM A485, 1 μM NEO2734, 1 μM GNE-781, 1 μM CCS-1477, 10 μM C646, 10 μM SGC-CBP30, or 20 μM anacardic acid. After 3 and 7 days, cell lysates were subjected to Western blotting analysis to detect MCPyV LTT and GAPDH expression. (B) PETA, MKL-1, MCC-13, and HDFs were treated with the indicated inhibitors for up to 9 days. Cell viability on days 0, 3, 6, and 9 was measured using the CellTiterGlo 3D assay. The % viability of the cells in each condition is expressed as the fold change in the sample’s CellTiterGlo reading relative to its d0 measurement. In each plot, the % viability of DMSO-treated cells is represented by a dotted black line, while the % viability of HATi-treated cells is represented by a solid colored line. Error bars represent the standard deviation of three independent experiments.

