. 2023 Jun 30;66(7):2278–2295. doi: 10.1044/2023_JSLHR-23-00012

Figure 1.

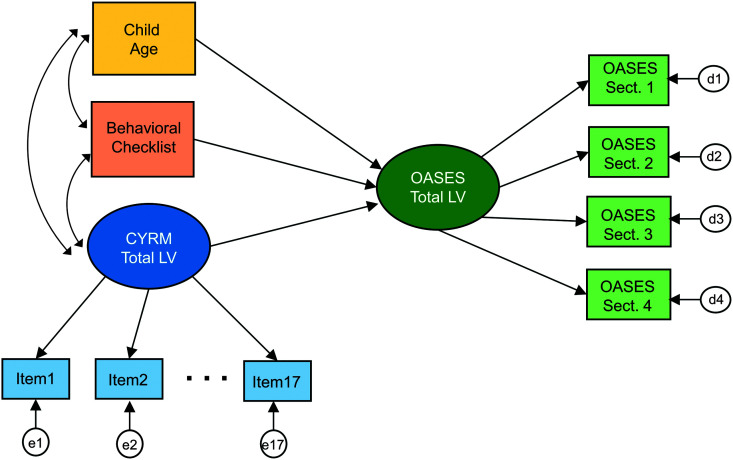
A diagram has 2 rectangles placed one below the other, on the top left. They are labeled child age and behavioral checklist. Below is an oval labeled C Y R M Total L V. The two rectangles and the oval are connected with two-way arrows. The oval is connected to small rectangular boxes below, labeled item 1, item 2, ellipsis, item 17. Tiny circles with e 1, e 2, and e 17 point to corresponding boxes. At the center is an oval labeled O A S E S total L V. Child age, behavioral checklist, and C Y R M Total L V point to O A S E S total L V. O A S E S total L V points to 4 boxes arranged one below the other. They are labeled O A S E S section 1, O A S E S section 2, O A S E S section 3, and O A S E S section 4. To the right of these boxes, there are 4 small circles with d 1, d 2, d 3, and d 4, pointing to each corresponding box.

Schematic diagram of the structural equation modeling framework used in the statistical analysis. The ovals represent latent (unobserved) variables, and the rectangles represent manifest (observed) variables. The e1–e17 terms represent measurement errors for the 17 CYRM-R items. The d1–d4 terms represent measurement errors for the four OASES sections. Curved, two-headed arrows represent covariances. Independent variables are allowed to covary as is standard in multiple variable regression. Straight, single-headed arrows represent direct paths (regression coefficients). OASES = Overall Assessment of the Speaker's Experience of Stuttering; CYRM = Child Youth and Resilience Measure; LV = latent variable.