. 2023 Jun 30;66(7):2278–2295. doi: 10.1044/2023_JSLHR-23-00012

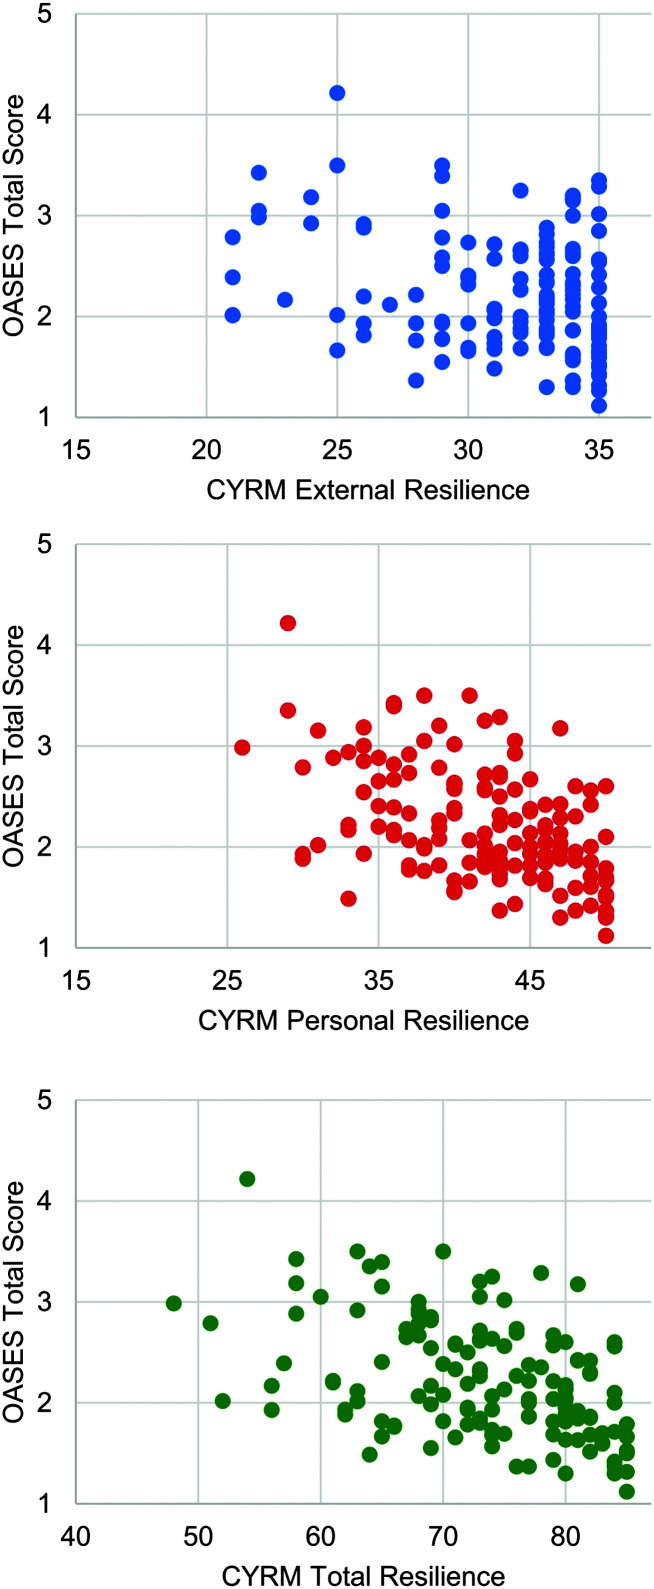
Figure 2.

Three graphs with data points have O A S E S total score from 1 to 5 on their vertical axes. Graph 1. The horizontal axis represents C Y R M external resilience from 10 to 20 with intervals of 5. Most data points are distributed between x values 20 and 35, and between y values 1 and 4, with dense clusters between y values 30 and 35. Graph 2. The horizontal axis represents C Y R M personal resilience from 15 to 50 with intervals of 10. Most data points are distributed between x values 25 and 50, and between y values 1 and 4, with dense clusters between y values 35 and 50. Graph 3. The horizontal axis represents C Y R M total resilience from 40 to 90 with intervals of 10. Most data points are distributed between x values 50 and 90, and between y values 1 and 4, with dense clusters between y values 65 and 90. All values are estimated.

Individual data points showing each child's resilience scores plotted against their average Overall Assessment of the Speaker's Experience of Stuttering (OASES) total score. The top graph presents external resilience scores; the middle graph, personal resilience scores; and the bottom graph, total resilience scores from the Child and Youth Resilience Measure.