. 2023 Jun 30;66(7):2278–2295. doi: 10.1044/2023_JSLHR-23-00012

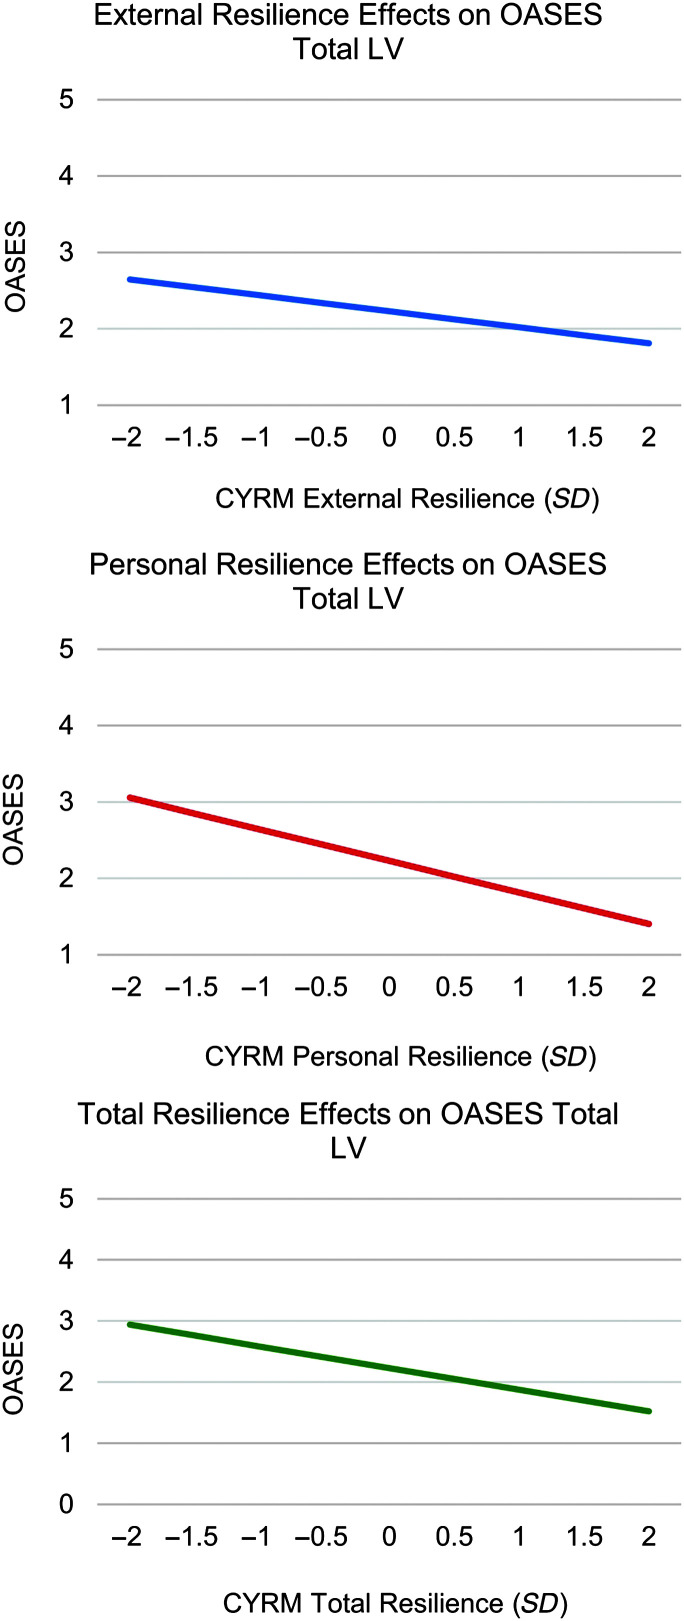
Figure 3.

Three line graphs. Graph 1. External resilience effects on O A S E S, total L V. The vertical axis represents O A S E S from 1 to 5. The horizontal axis represents C Y R M External resilience, S D, from negative 2 to 2. The line begins at (negative 2, 2.7) and ends at (2, 1.9). Graph 2. Personal resilience effects on O A S E S, total L V. The vertical axis represents O A S E S from 1 to 5. The horizontal axis represents C Y R M personal resilience, S D, from negative 2 to 2. The line begins at (negative 2, 3.0) and ends at (2, 1.4). Graph 3. Total resilience effects on O A S E S, total L V. The vertical axis represents O A S E S from 0 to 5. The horizontal axis represents C Y R M total resilience, S D, from negative 2 to 2. The line begins at (negative 2, 3.0) and ends at (2, 1.5). All values are estimated.

These graphs depict the results from the three structural equation models assessing the effects of resilience on the adverse impact of stuttering. The top graph presents the significant linear relationship between the Child and Youth Resilience Measure (CYRM) external latent variable (LV) and the Overall Assessment of the Speaker's Experience of Stuttering (OASES) total LV, the middle graph presents the significant linear relationship between the CYRM personal LV and the OASES total LV, and the bottom graph presents the significant linear relationship between the CYRM total LV and the OASES total LV.