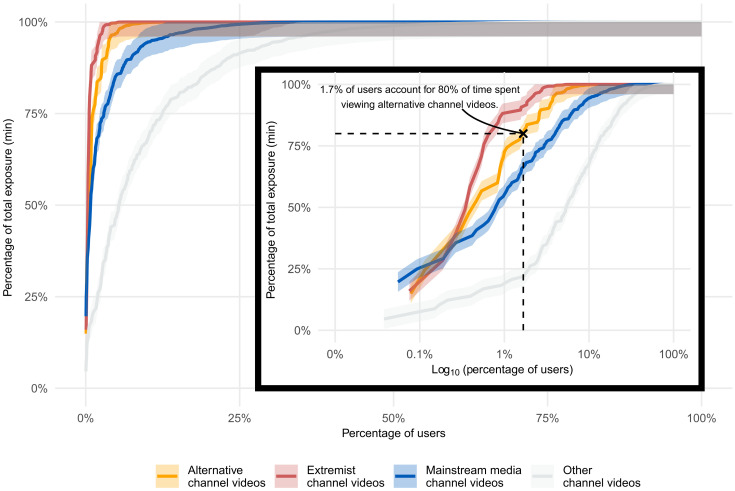
Fig. 2. Concentration of exposure to alternative and extremist channels.
Weighted empirical cumulative distribution function showing the percentage of participants responsible for a given level of total observed video viewership of alternative and extremist channels on YouTube (in minutes). Each estimate includes the corresponding 95% CI (unweighted N = 1181). Inset graph shows the same data using a log scale for the weighted empirical cumulative distribution function.

