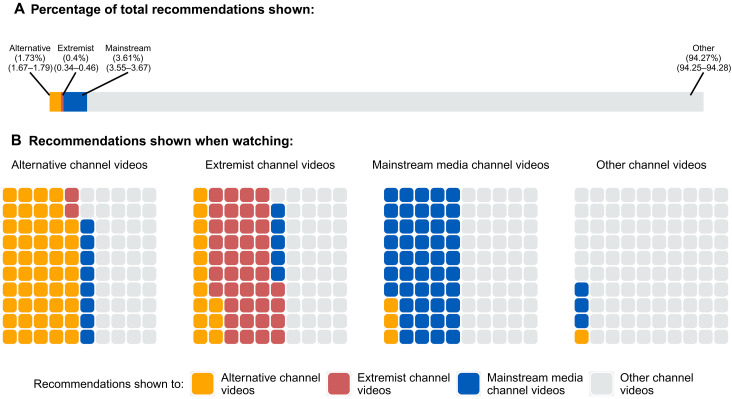
Fig. 5. Recommendation frequency by type of channel being watched.
Number of colored tiles shown are proportional to the proportion of recommendations shown for each type of video when watching videos from alternative, extremist, mainstream media, or other channels. (A) summarizes the percentage of recommendations shown by channel type and (B) disaggregates the recommendations shown by channel type for the video being watched. Results are based on the full set of recommendations that we could extract from each video and incorporate survey weights. Each category estimate includes the corresponding 95% CI (unweighted N = 8,303,137).

