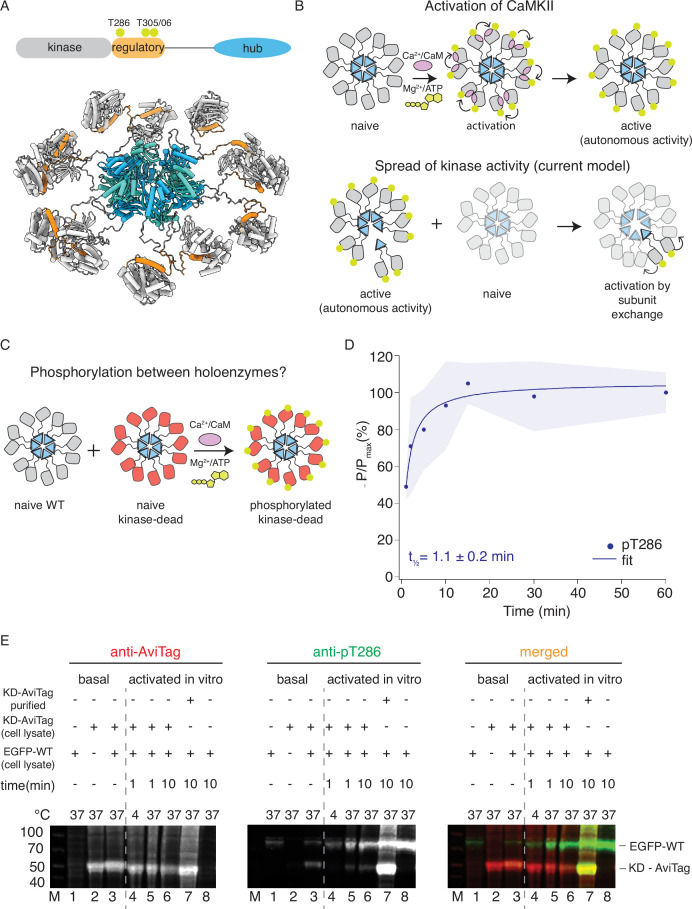
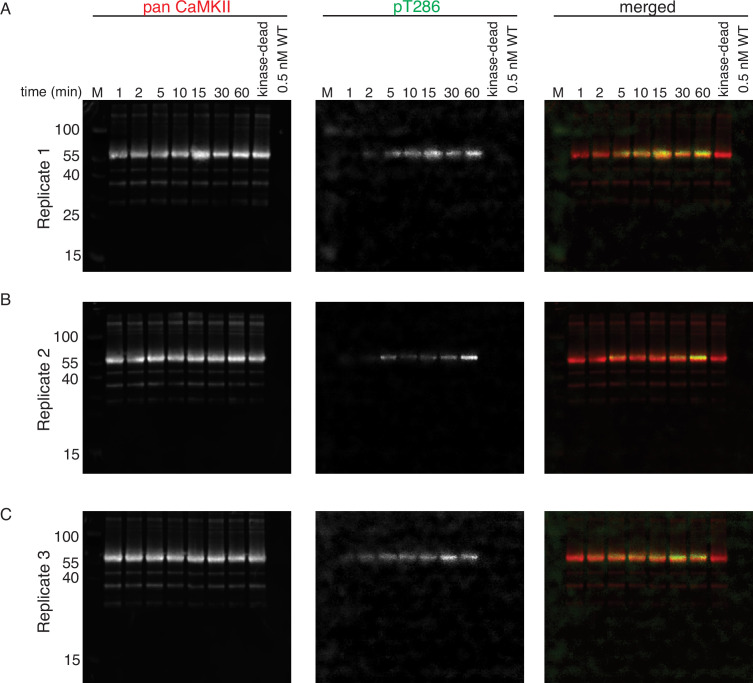
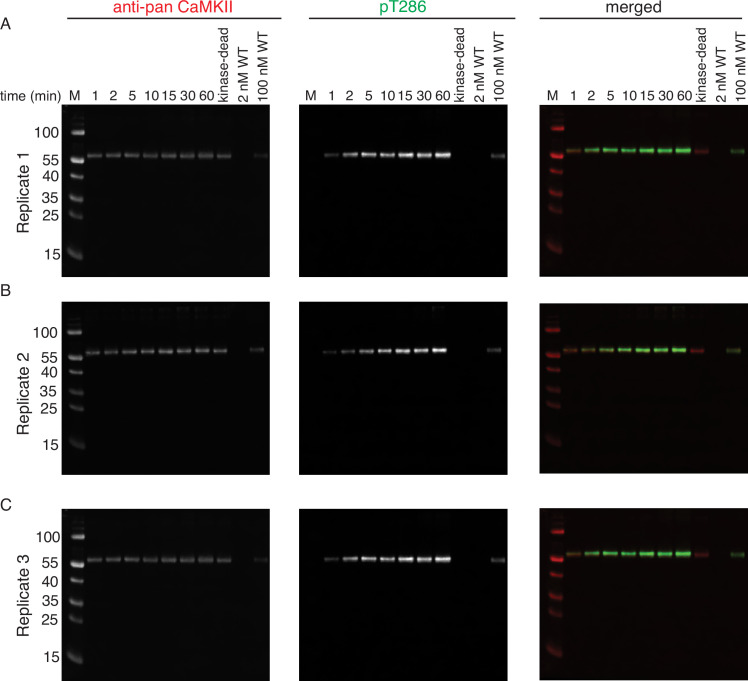
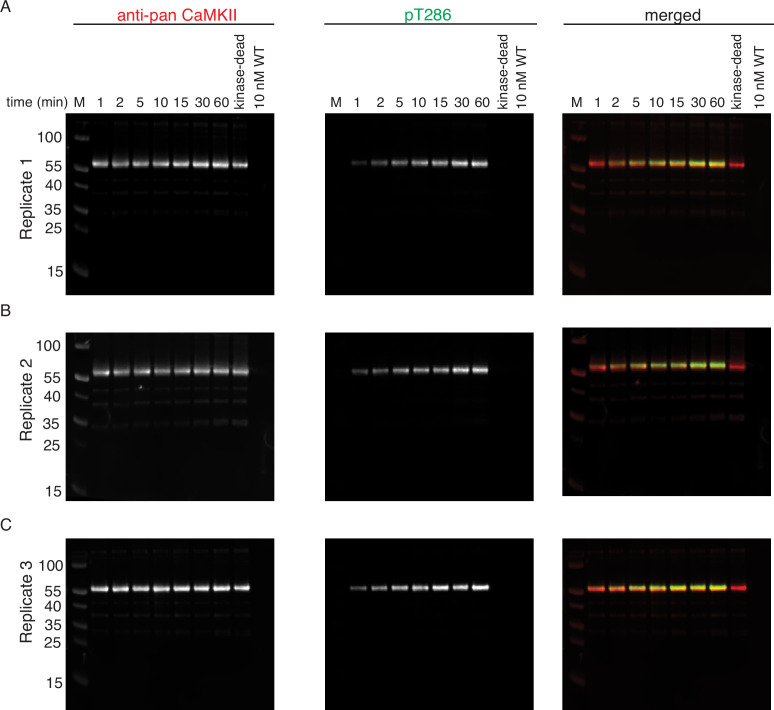
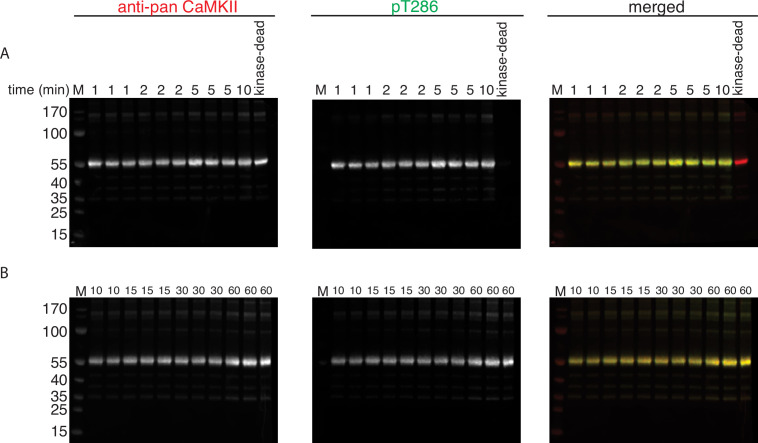
Figure 1. CaMKIIWT phosphorylates CaMKIIKD.
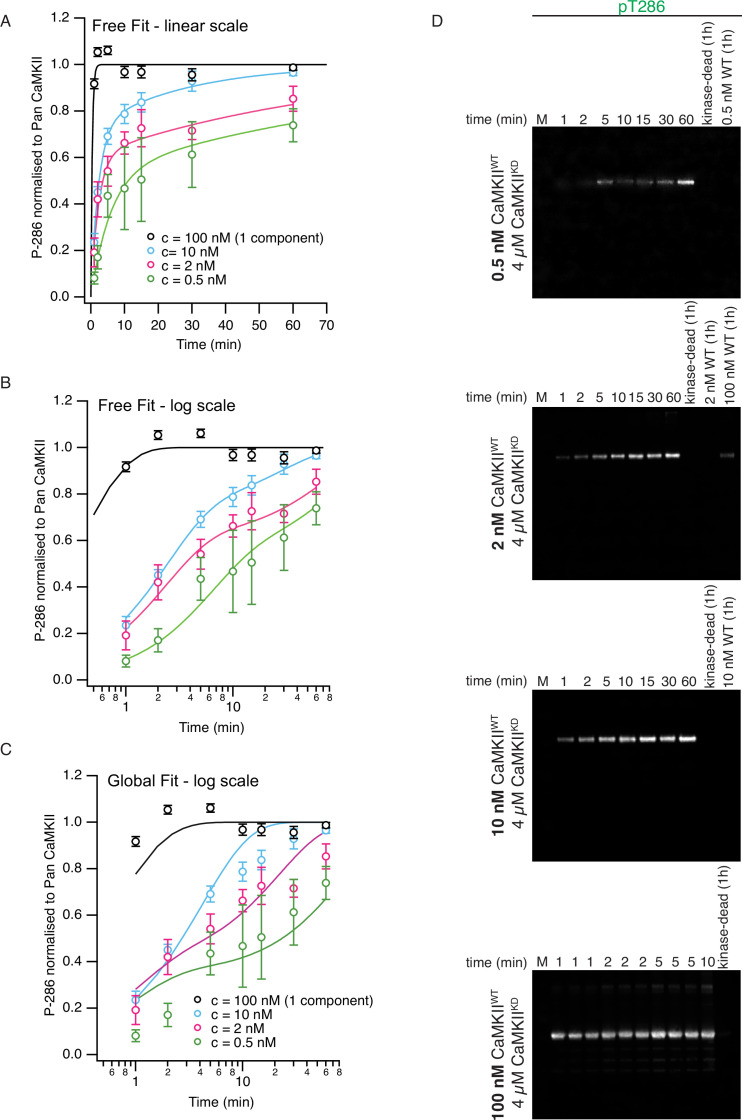
(A) Schematic representation of CaMKIIα domain arrangement (top). Yellow circles indicate phosphorylation sites. CaMKIIα holoenzyme structure (bottom, PDB:5u6y). (B) Cartoon representation of activation of CaMKII by calcium:calmodulin (top) and proposed mechanism for spread of kinase activity (bottom). Yellow circles indicate phosphorylation sites. (C) Schematic representation of experiment performed in panel (D). (D) Kinase activity of CaMKIIWT (10 nM) against CaMKIIKD (4 μM). Half-time of maximum phosphorylation (t1⁄2=1.1 ± 0.2 min) determined by western blot, using an antibody against pT286. These data were fit with a single component, see Figure 1—figure supplement 3 for a fit to a repeated experiment with two components. The shading represents standard deviation (SD) from the mean value of three technical replicates. (E) Kinase activity of EGFP-CaMKIIWT and CaMKIIKD-AviTag in HEK cells and HEK cell lysates. ‘Basal’: activity in cells; ‘activated in vitro’: activity in cell lysates supplemented with 1 μM purified Ca2+:CaM and 0.5 mM ATP:Mg2+. Lane 1 – autophosphorylation of EGFP-CaMKIIWT in singly transfected cells, lane 2 – autophosphorylation of CaMKIIKD-AviTag in singly transfected cells, lane 3 – autophosphorylation of EGFP-CaMKIIWT and CaMKIIKD-AviTag in co-transfected cells, lane 4 – stimulated kinase activity of EGFP-CaMKIIWT from lysate in lane 1 and CaMKIIKD-AviTag from lysate in lane 2, incubated together at 4 °C for 1 min, lane 5 - stimulated kinase activity of EGFP-CaMKIIWT from lysate in lane 1 and CaMKIIKD-AviTag from lysate in lane 2, incubated together at 37 °C for 1 min, lane 6 - stimulated kinase activity of EGFP-CaMKIIWT from lysate in lane 1 and CaMKIIKD-AviTag from lysate in lane 2, incubated together at 37 °C for 10 min, lane 7 - stimulated kinase activity of EGFP-CaMKIIWT from lysate in lane 1 and 8 μM purified CaMKIIKD-AviTag, incubated together at 37 °C for 10 min, lane 8 - stimulated kinase activity of EGFP-CaMKIIWT from lysate in lane 1 37 °C for 10 min.

