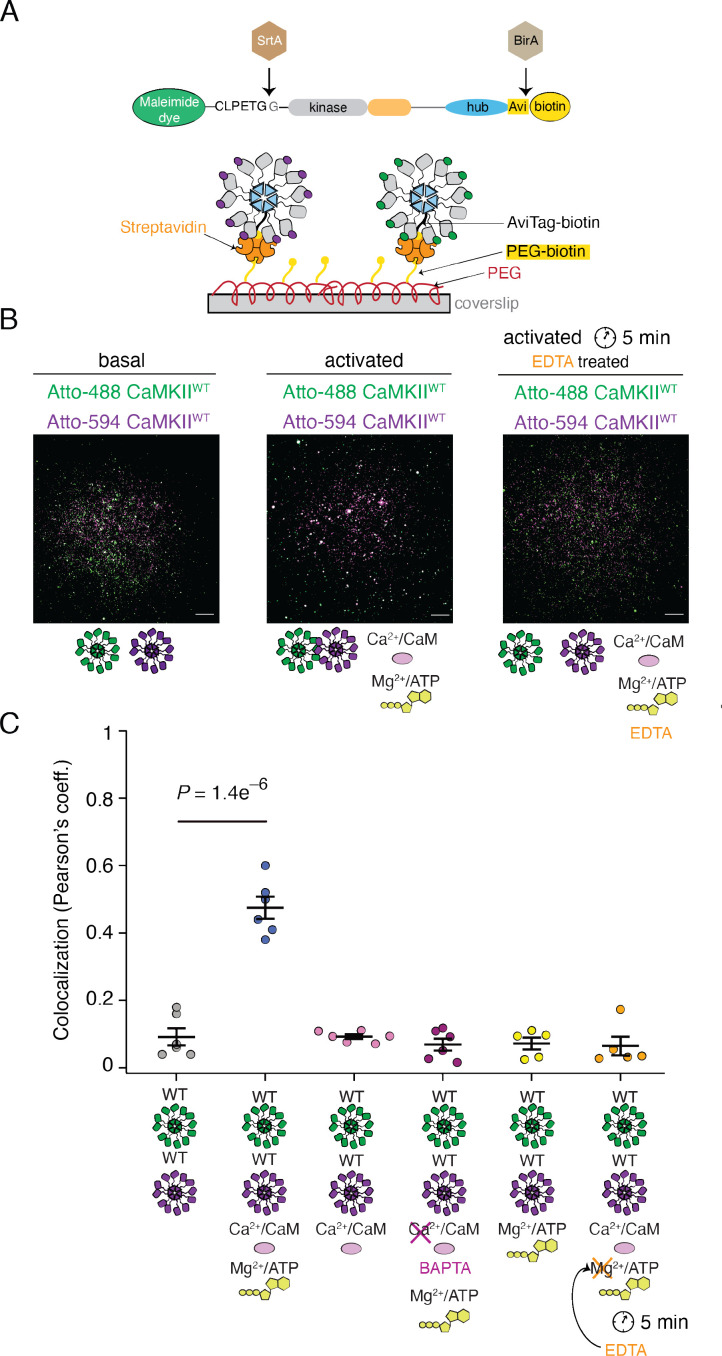
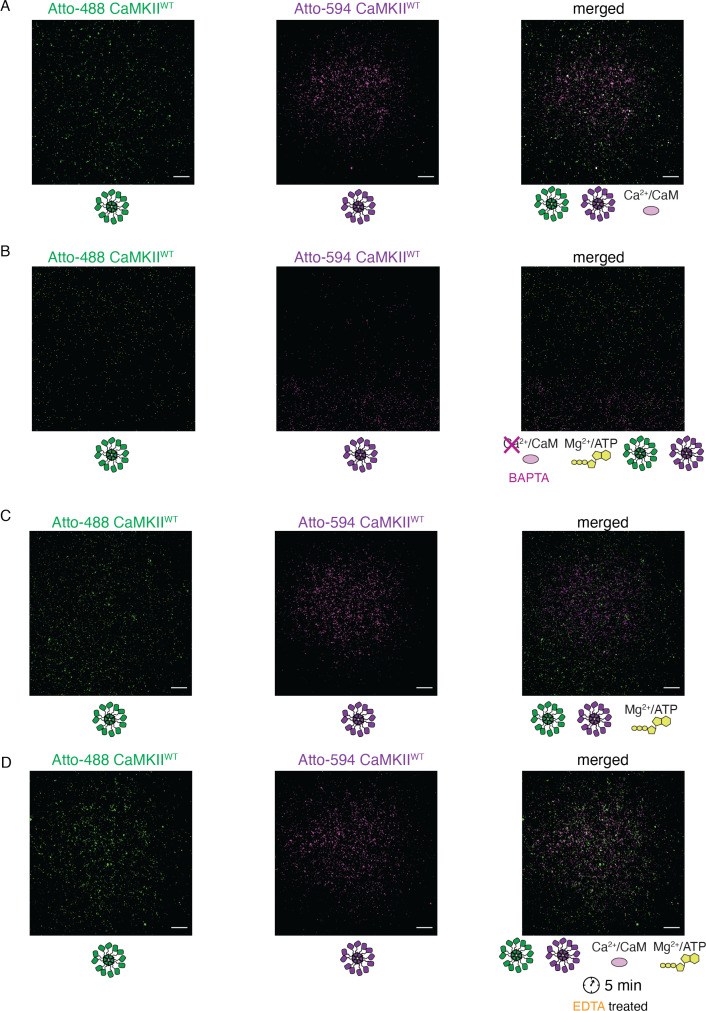
Figure 6. Reversible activity-dependent colocalization of CaMKII holoenzymes.
(A) Schematic representation of CaMKII in vitro enzymatic labeling with maleimide dyes and biotin, and TIRF experimental set-up. (B) Representative TIRF images of unactivated (basal) CaMKIIWT sample (left), activated CaMKIIWT sample (middle), and CaMKIIWT sample first activated and then quenched with EDTA (right). Raw, unprocessed, images are shown. (C) Summary of colocalization analysis (Pearson coefficient) for TIRF images for CaMKII under different conditions. Statistical significance was calculated using a multi-comparison test (Dunnett test) with α=0.05. Mean and standard deviation of the mean are indicated. Each condition was done at least two times on different days, with different protein preps. Five ROIs coming from different slides were selected for analysis for each condition. Scale bar: 10 µm.


