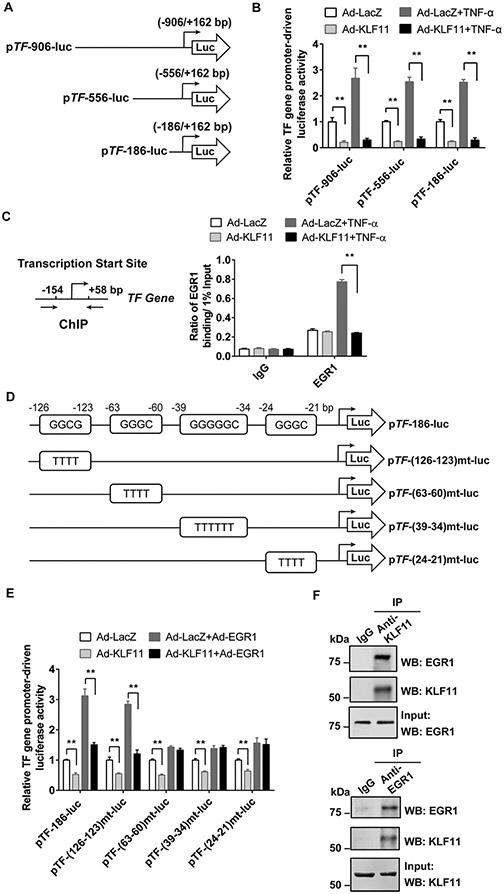
Fig. 5.
KLF11 inhibits EGR1-induced TF gene transcription. (A) The simplified structure illustration of luciferase reporters driven by different lengths of human TF gene promoter (pTF). (B) Bovine aortic endothelial cells (BAECs) were transfected with pTF-luciferase reporters with varying sizes of promoter (A) for 24 hours and then infected with Ad-LacZ or Ad-KLF11 (10 MOI). Forty-eight hours after infection, BAECs were stimulated with TNF-α (10 ng/mL) for 12 hours. The luciferase activity was measured and normalized by Renilla activity. The results are presented relative to the group infected with Ad-LacZ (B). (C) Human umbilical vein endothelial cells (HUVECs) were infected with Ad-LacZ or Ad-KLF11 (10 MOI) for 48 hours, followed by TNF-α (10 ng/mL) stimulation for 4 hours. The binding of EGR1 to the TF gene promoter was determined by chromatin immunoprecipitation (ChIP) assay using an antibody against EGR1. (D) TF gene promoter-driven luciferase reporters pTF-186-luc with wild-type (Wt) or different EGR1-binding region mutants are shown in the simplified illustration. (E) BAECs were transfected with pTF-Wt-luc or several pTF-mt-luc luciferase reporters for 24 hours and then co-infected with Ad-EGR1 (5 MOI) with Ad-LacZ or Ad-KLF11 (5 MOI) for 48 hours. The luciferase activity was measured and normalized by Renilla activity. The results are presented relative to the group infected with Ad-LacZ. **p < 0.01 using two-way ANOVA followed by Bonferroni test. (F) HUVECs were co-infected with Ad-EGR1 (5 MOI) and Ad-KLF11 (5 MOI) for 48 hours. The cell lysates were subjected to immunoprecipitation (IP) with antibodies against KLF11 or IgG (upper panel), or EGR1 or IgG (lower panel). The precipitates were analyzed by Western blot (WB) using antibodies against KLF11 and EGR1. The co-immunoprecipitated EGR1 or KLF11 is presented. Data are presented as mean ± SEM. ANOVA, analysis of variance; SEM, standard error of the mean; TNF-α, tumor necrosis factor-α.

