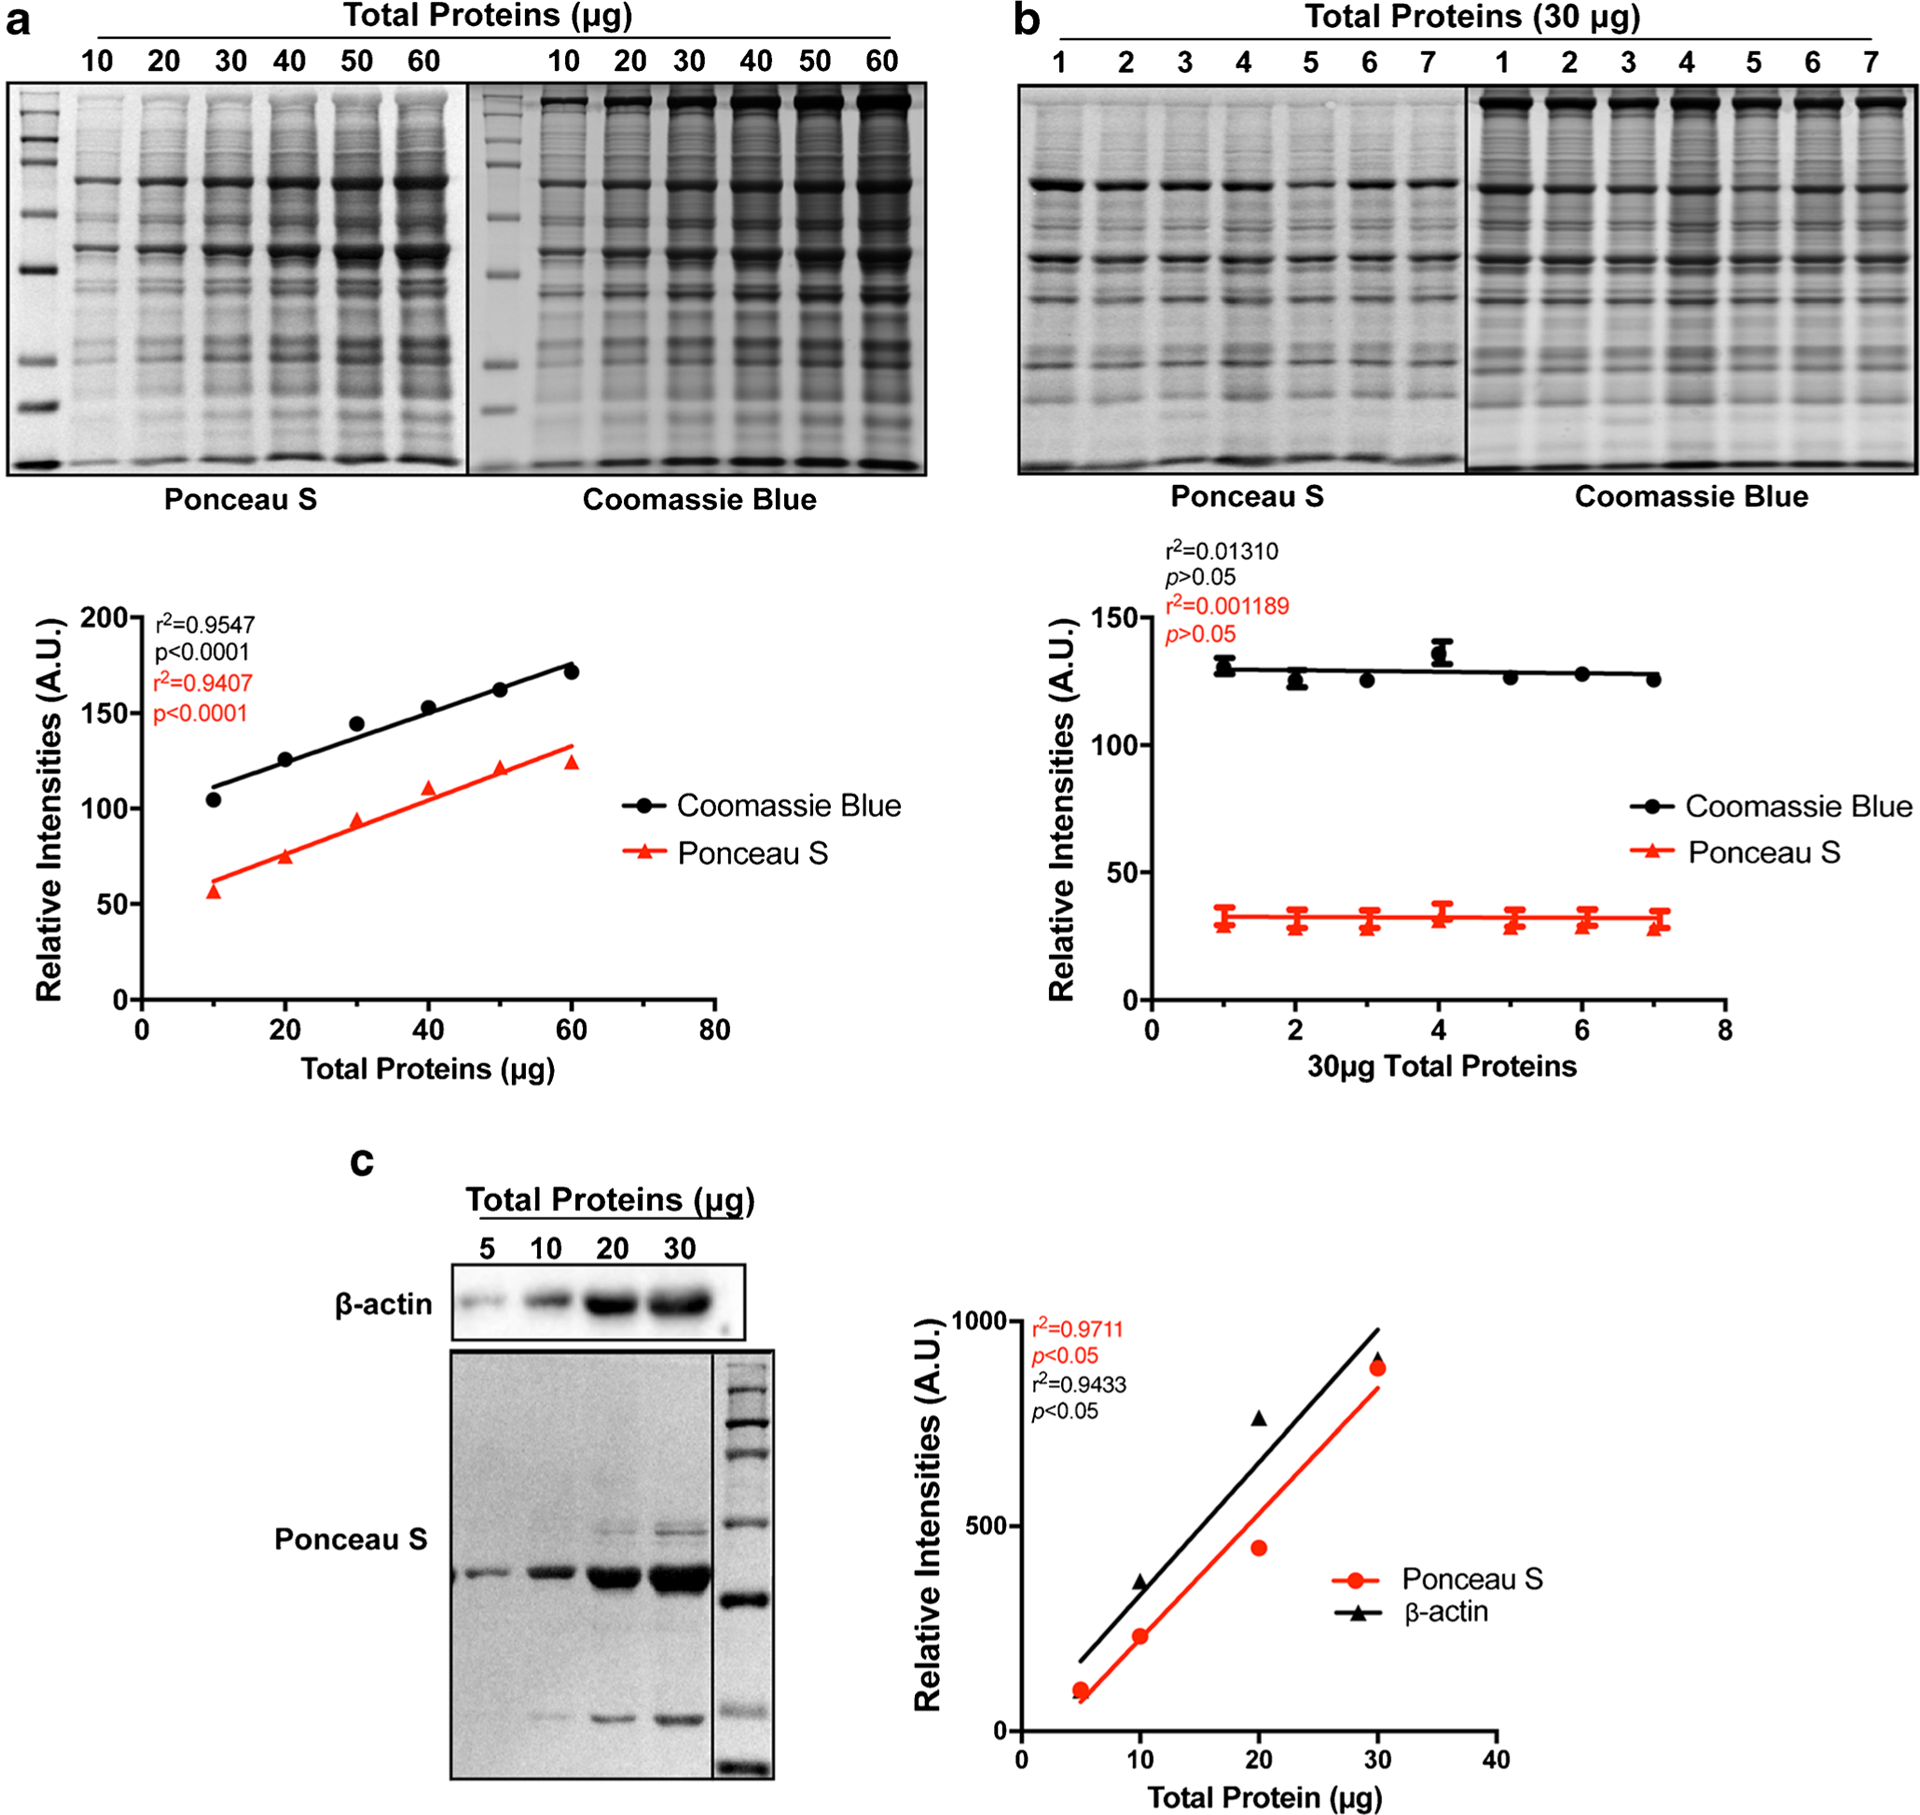
Fig. 1.

Highly correlated total protein amounts and quantified values from Ponceau S (PS) blot-stained and Coomassie Blue (CB) gel-stained images. a Representative images of PS (upper panel, left) and CB (upper panel, right) and linear regression (bottom panel) of various amounts of loaded total proteins and quantified total proteins from Ponceau S blot-stained (PS) and Coomassie blue (CB) gel-stained images. b Representative images of PS (upper panel, left) and CB (upper panel, right) and quantitative results of 30 μg total proteins of each human RA homogenate samples from PS- and CB-stained images. c Representative images of β-actin immunoblot (upper panel, left) and PS blot staining (upper panel, left) as well as linear regression (right) of various amounts of β-actin proteins and quantified total proteins from Ponceau S (PS) blot-stained image
