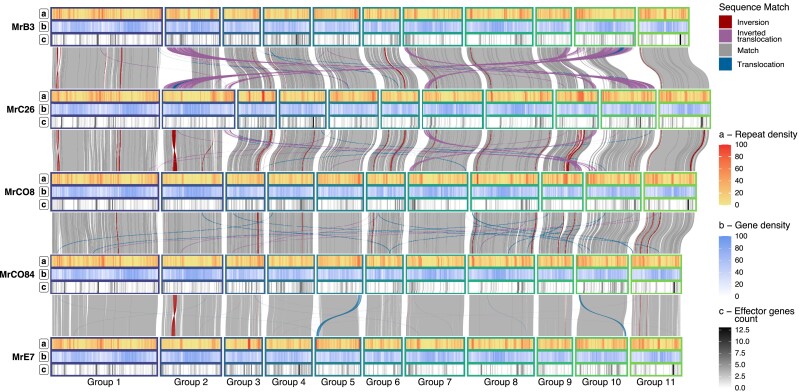
Fig. 1.
Colinearity between M. roreri isolates syntenic groups. Colinear regions between the 5 isolates have been depicted across the 5 different M. roreri isolates evidencing distant translocation events (blue) and inversions (red). For each of the genotypes, the 3 tracks reported indicate a) the local repeat density in terms of percentage of bases associated to a repetitive element, b) the local gene density in terms of bases ascribed to gene loci, and c) the effector gene density in terms of number of genes in a 100 Kb window.

