
Fig. 2. Uptake and assimilation of dissolved inorganic N and P.
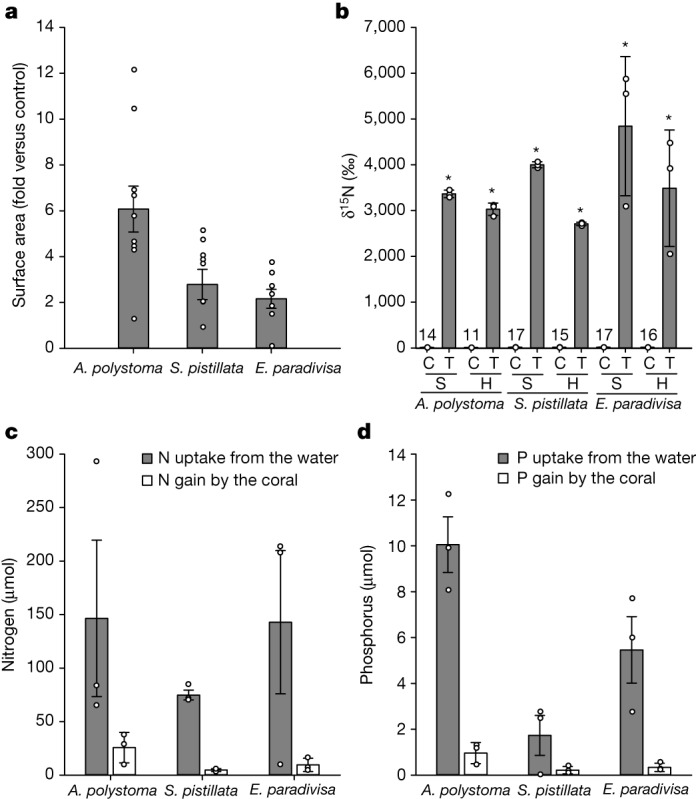
a, Increase in coral surface area in response to defined pulses with 15NO3 and PO4 relative to untreated controls. n is the number of independent individuals per species for treatments (T) and controls (C). A. polystoma: nt = 10, nc = 10; S. pistillata: nt = 9, nc = 8; E. paradivisa: nt = 7, nc = 7. b, δ15N (‰) of host tissue (H) and symbionts (S) in response to treatment with defined 15NO3 pulses compared with untreated controls. Numbers above control bars indicate the δ15N (‰) values. Data are mean ± s.d. of replicate samples for each species (n = 3 independent host tissue or symbiont samples from independent individuals for all species, except n = 2 for E. paradivisa control). Asterisks indicate statistically significant differences between treatment and control (n = 3 independent biological species per symbiont community); t-test pairwise comparisons, two-tailed PH = 0.0002, PS = 0.0007. c,d, The amount of N and P taken up from the water and the N and P gain of host tissue and symbionts over 217 days. Data are mean normalized to the coral surface area. Error bars represent the s.e.m. of N and P uptake from the water from n = 3 independent measurements on three different days and of N and P gain by the coral from n = 3 independent tissue samples from different individuals.