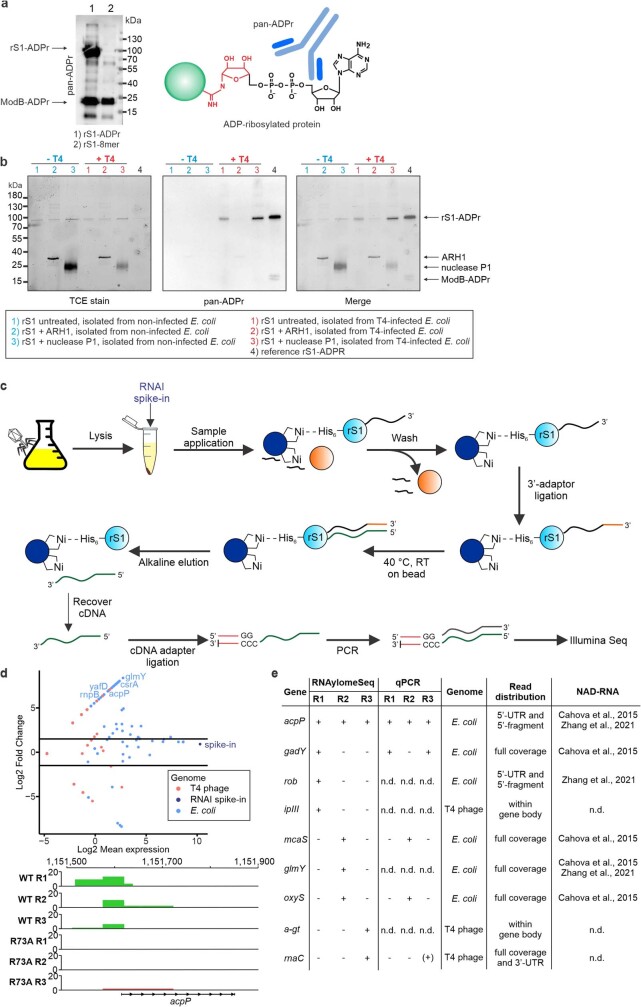
Extended Data Fig. 6. In vivo characterisation of the RNAylation by Western blot and RNAylomeSeq.
a, Analysis of the substrate specificity of the pan-ADPr antibody. In vitro prepared ADP-ribosylated or RNAylated protein rS1 was applied to evaluate the specificity of the antibody (n = 3). The pan-ADPr antibody detected ADP-ribosylated proteins rS1 and ModB (lane 1). In contrast, RNAylated rS1 is not detected by pan-ADPr (lane 2). However, a signal for ADP-ribosylated ModB was observed due to self-ADP-ribosylation in its expression host E. coli (lane 2). b, Quantification of RNAylation using the combination of nuclease P1 digest and detection of protein-linked ADP-ribose by Western blot. Visualisation of protein load by TCE stain. Removal of the ADP-ribose signal by ARH1 treatment. pan-ADPr signals for ADP-ribosylated rS1 were normalised to corresponding band intensities in the TCE stain. Normalised intensities for untreated rS1 were then divided by the intensity for P1-treated rS1 to yield the fractions of ADP-ribosylated and RNAylated rS1 among the two modifications. The corresponding dot plot is shown in Fig. 4b (n = 3 biologically independent replicates). c, Schematic illustration of the RNAylomeSeq protocol: Identification of RNAylated RNAs which are covalently attached to rS1 in vivo. Briefly, endogenously His-tagged rS1 is isolated from T4 phage infected E. coli with Ni-NTA beads. A spike-in - rS1 domain 2 RNAylated with NAD-RNAI - (RNAI spike-in) is added to the lysate which is meant to be enriched via the RNAylomeSeq workflow. rS1 captured on Ni-NTA beads is intensively washed with 8 M urea in order to remove RNA non-covalently bound to rS1. Similar to NAD captureSeq32, an RNA 3′-adapter is ligated to covalently linked RNAs and RNA is reverse transcribed “on-bead”. cDNA is then eluted by alkaline digest of RNA and an additional adapter is ligated to the 3′-terminus of the cDNA. cDNA is amplified by PCR and sequenced by next-generation single-end sequencing (Illumina). Importantly, the RNAI spike-in is not meant to be enriched in any sample but rather to be found in each sample in similar amounts. Thereby, read counts can be normalised to the RNAI counts in each sample allowing for their comparison. d, MA plot showing RNAs enriched in the T4 phage WT infected sample compared to T4 phage ModB R73A, G74A control identified by RNAylomeSeq for replicate 2 (total of n = 3 biological replicates). Read counts per sample have been normalised to RNAI spike-in read counts which serves as an enrichment control for each sample. Thus, RNAI is not found enriched comparing T4 WT and T4 ModB R73A, G74A. Mean expression values (T4 WT and T4 ModB R73A, G74A condition) have been normalised by Log2 (x-axis) for each replicate separately. T4 WT and T4 ModB R73A, G74A read counts were compared via log2 fold change (y-axis). Read coverage on identified RNAylated RNAs as analysed in IGV is exemplarily shown for acpP in the lower panel depicting reads in T4 WT samples (green) vs. T4 ModB R73A, G74A samples (red). RNAylomeSeq merely identifies 5’-termini of mRNAs or, if 200nt or smaller, entire sRNA sequences. This is due to the application of single-end Illumina-Seq which automatically only captures the 5’-end of the respective read/transcript. e, Selected hits of RNAs identified by RNAylomeSeq comparing T4 phage WT and T4 ModB R73A, G74A. acpP was identified in all three replicates. However, some transcripts were only detected in one or two replicates. Enrichments have been further validated on cDNA level by qPCR. +: enriched; −: not enriched; (+): enriched, but Log2 fold change <= 1; n.d.: not defined.

