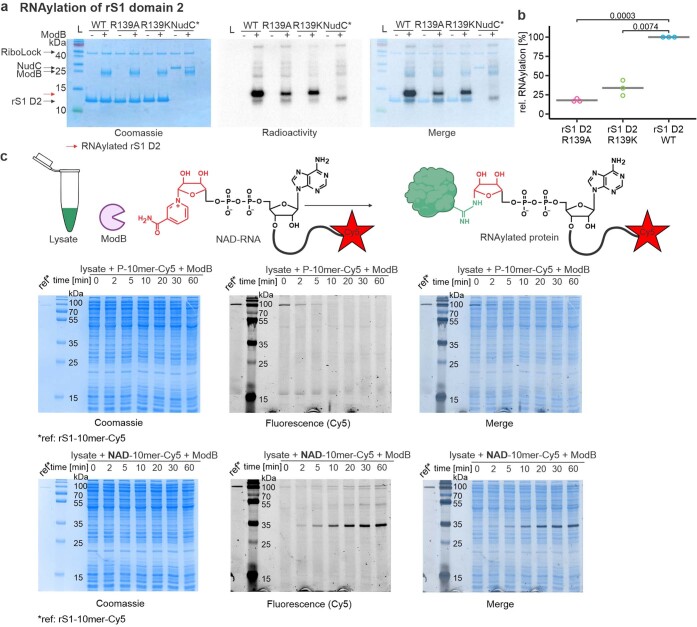
Extended Data Fig. 8. Characterisation and identification of RNAylation target proteins of ModB.
a, Analysis of the in vitro RNAylation of rS1 domain 2 and its mutants R139A and R139K by 16 % Tricine-SDS-PAGE. An inactive NudC mutant (NudC*; V157A, E174A, E177A, E178A) was used as a negative control (n = 3). Radioactivity indicates RNAylation, Coomassie scan visualises protein load. b, Quantification of relative intensities of RNAylation of rS1 domain 2 and its mutants R139A and R139K based on radioactivity in 16 % Tricine-SDS-PAGE analysis. Per replicate, intensities were normalised to the rS1 D2 WT band intensity. A two-sided t-test was performed at psignif. < 0.05 indicating significantly decreased RNAylation of R139 mutants of rS1 domain 2 (p-value = 0.0003 (WT vs. R139A) and 0.0074 (WT vs. R139K)). n = 3 of biologically independent replicates. c, RNAylation of E. coli cell lysate by ModB using 3′-Cy5-labelled NAD-RNA (schematically shown in upper panel). A time course of E. coli cell lysate RNAylation by ModB in the presence of either a 5′-monophosphorylated RNA 10mer (P-10mer-Cy5, middle panel) or 5′-NAD-capped RNA 10mer (NAD-10mer-Cy5, lower panel), each with a 3′-fluorescent (Cy5) label. rS1 RNAylated with an NAD-10mer-Cy5 is applied as a reference (ref). The time course of lysate RNAylation was analysed by 12 % SDS-PAGE, protein visualised by Coomassie staining and RNAylation recorded via fluorescence (Cy5). n = 3 of biologically independent replicates. NAD concentration in the lysates exceeds the utilised NAD-10mer concentration by 48-fold. NAD concentration in the lysates of 22.5 µM (n = 1 biologically independent replicates, n = 3 technical replicates) was determined using the NAD/NADH-Glo assay (Promega). The schematic protein and tube in c were created using BioRender (https://biorender.com).

