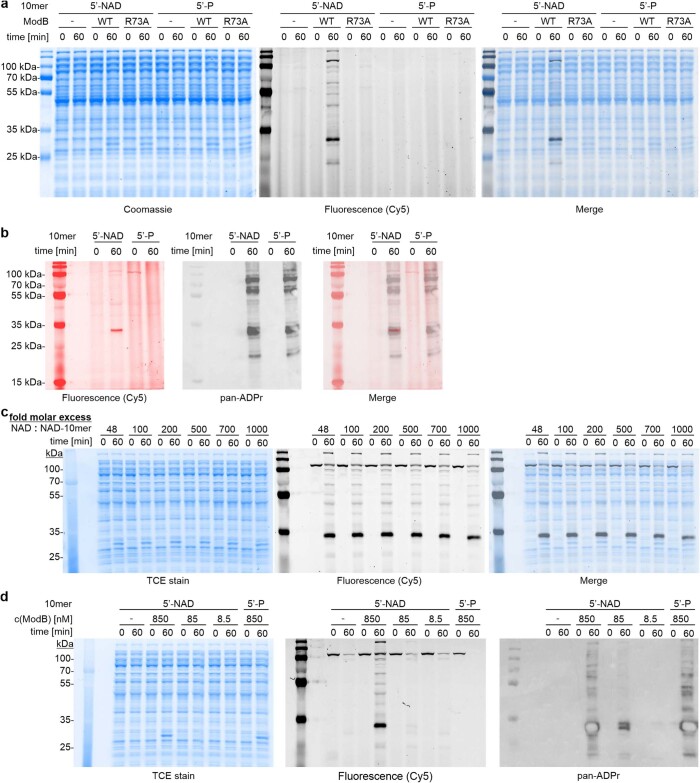
Extended Data Fig. 9. Characterisation of the specificity of ModB-mediated RNAylation in E. coli lysates.
a, RNAylation of E. coli cell lysate in the presence of ModB WT or inactive ModB R73A, G73A or the absence of ModB using 3′-Cy5-labelled NAD-10mer or P-10mer. Time point 0 shows lysate before addition of ModB, 60 min shows RNAylation after 60 min incubation with ModB. Reactions were analysed by 12 % SDS-PAGE, protein visualised by Coomassie staining and RNAylation recorded via fluorescence (Cy5). n = 2 of biologically independent replicates. b, Samples from lysate RNAylation with Cy5-labelled 5′-NAD- or 5′-P-10mer (as presented in Extended Data Fig. 8c) before addition of ModB (0 min) and after 60 min incubation in the presence of ModB (60 min) were analysed by 10 % SDS-PAGE and RNAylation monitored by fluorescence (Cy5, here shown in red). Subsequently, Western blotting was performed and ADP-ribosylation was detected using pan-ADPr binding reagent (MABE1016, shown in grayscale). n = 2 of biologically independent replicates. Different band patterns were observed for ModB-mediated RNAylation and ADP-ribosylation in E. coli lysates indicating a distinct target specificity of ModB for RNAylation. NAD concentration in the lysates exceeds utilised NAD-10mer concentration by 48-fold. NAD concentration in the lysates of 22.5 µM (n = 1 biologically independent replicates, n = 3 technical replicates) was determined using the NAD/NADH-Glo assay (Promega). c, Lysate RNAylation by ModB in the presence of various molar excesses of NAD over NAD-10mer-Cy5 ranging from 48-fold (native lysate) to 1000-fold via additional spike-in NAD (n = 2). Cy5 represents RNAylation. TCE stain indicates protein load, which is enabled by binding of trichloroethanol in the gel to tryptophan residues in proteins which enhances their fluorescence under UV light and thereby enables their detection53. 700-fold molar excess of NAD reduces RNAylation to 67 % (n = 2 biologically independent replicates) compared to “native” lysate. Total Cy5 signals for each lane were quantified to determine and compare RNAylation levels. d, Lysate RNAylation and ADP-ribosylation in the presence of various ModB concentrations (850, 85 and 8.5 nM) monitored by fluorescence (Cy5 for RNAylation) and Western blot (pan-ADPr for ADP-ribosylation). TCE stain indicates protein load. In average, RNAylation is reduced to 8.6 % and ADP-ribosylation is reduced to 6.9 % in lysates with ModB concentrations that approximate the cellular conditions (85 nM). Total Cy5 or pan-ADPr signals (excluding ModB ADP-ribosylation signal) for each lane were quantified to determine and compare RNAylation or ADP-ribosylation levels, respectively. n = 2 biologically independent replicates.

