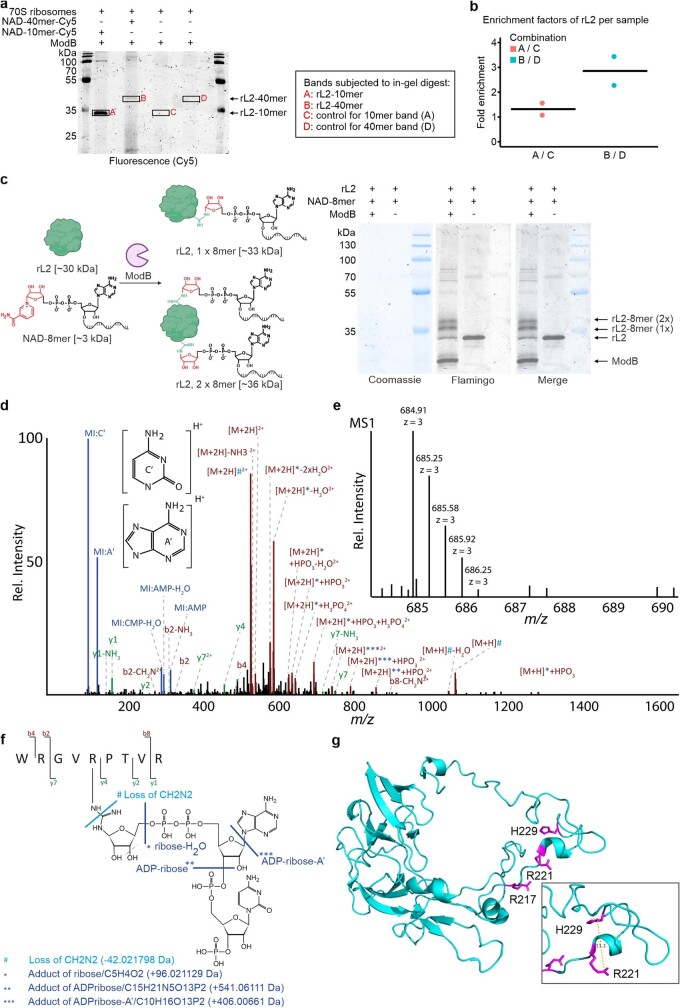
Extended Data Fig. 10. Scope of ModB RNAylation targets in E. coli.
a, RNAylation of E. coli ribosomes by ModB. RNAylated protein is shifted upon incubation with NAD-40mer compared to NAD-10mer which itself increases protein weight by approx. 3 kDa. Relative enrichment of RNAylated target protein was assessed by subjecting RNAylated protein bands and respective control bands generated in the absence of RNA to in-gel digest and LC-MS/MS analysis (n = 2). b, Plot of the enrichment of fractional spectral counts for 50S ribosomal protein L2 (rL2) based on in-gel-digest and LC-MS/MS analysis presented in a. Enrichment is calculated for RNAylation with NAD-10mer (A/C) or NAD-40mer (B/D), relative to the respective, non-RNAylated control bands based on spectral counts from Scaffold (n = 2). c, Analysis of the in vitro RNAylation of rL2 by ModB in the presence of NAD-8mer. RNAylated rL2 proteins have reduced electrophoretic mobility during SDS-PAGE. Protein was visualised by fluorescent protein stain (Flamingo) and protein ladder visualised by Coomassie staining. Signals were quantified using ImageLab indicating that about 80 % of rL2 is RNAylated by ModB in vitro (n = 3). Band patterns indicated that rL2 can be RNAylated once or even twice in vitro. d–f, Tandem MS-based identification of RNAylated rL2 peptide. d, MS/MS fragment ion spectrum (spectrum ID: 8679) of RNAylated rL2 peptide WRGVRPTVR carrying ADP-ribose plus cytidine-monophosphate and a 3′-phosphate group. The spectrum shows marker ions of adenine (A’) and cytosine (C’) as well as AMP and CMP. The precursor ion ([M+xH]x+) is detected unshifted, shifted by the mass of ADP-ribose (*) and by ADP-ribose with adenine loss (**). Also, precursor ions show a specific loss of 42.021798 Da, which can be explained by a loss of CH2N2 at the modified arginine. e, Isotopic peak pattern of the precursor ion shown in d, as detected in the corresponding MS precursor ion scan. f, Schematic sequence and RNA adduct representation of the RNAylated peptide shown in d and e including annotations of fragment ions. The fragmentation products observed in the MS/MS spectrum, shown in d, of the ADP-ribose+CMP+3′-phosphate adduct are indicated in the structure by light blue (mass loss) and dark blue (mass adducts) lines. g, Selected RNAylated residues of rL2 identified by LC-MS/MS. The catalytically important H229 is 11.1 Å apart from R221. rL2 structure derived from a 1.98 Å cryo-EM structure (7K00)66. The schematic protein in c was created using BioRender (https://biorender.com).

