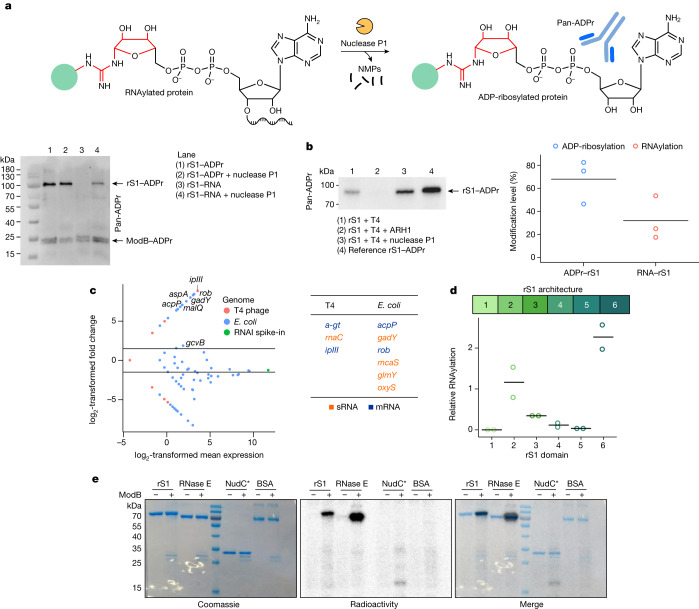
Fig. 4. In vivo characterization of ADP-ribosylation and RNAylation.
a, Quantification of the RNAylation of rS1 using a nuclease P1 digest and western blot analysis. Green circle represents the protein. b, Quantification of rS1 RNAylation in vivo based on biological triplicates (n = 3). Data are shown as mean (grey bar) and individual data points. Complete blots and intensity normalization are shown in Extended Data Fig. 6b. c, Identification of RNA substrates of ModB using RNAylomeSeq. The MA plot shows data for one of three biological replicates (n = 3). Further details are given in Extended Data Fig. 6c,d. d, Quantification of the RNAylation of rS1. Modification of rS1 domains 1–6 (n = 2 biologically independent replicates; black lines show the mean). e, SDS–PAGE analysis of the RNAylation of protein rS1, RNase E, inactive NudC mutant (NudC*: V157A, E174A, E177A, E178A) and bovine serum albumin (BSA) by ModB (n = 2 biologically independent replicates).

