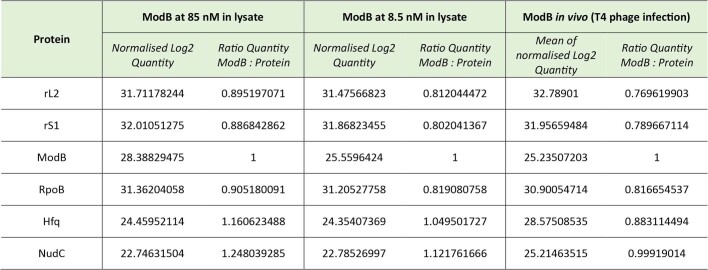
Extended Data Table 3.
Comparison of ModB protein intensities in lysate assay and in vivo via proteomics
Normalised Log2 intensities for selected E. coli proteins and ModB found in proteomic analysis of E. coli cell lysates for in vitro RNAylation (n = 1) and in a previously published data set of the E. coli and T4 phage proteome 5 min post-infection38 (n = 3). Intensity of ModB is divided by the intensity for various E. coli proteins. At 8.5 nM ModB, the ratios approximate conditions found in vivo. Raw data is presented in Supplementary Table 5.

